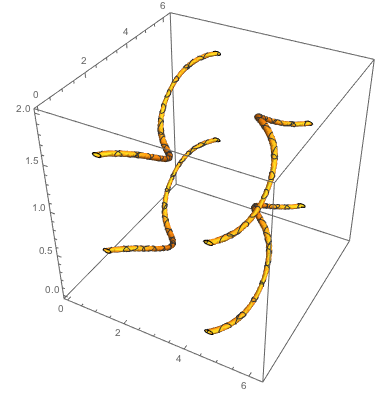
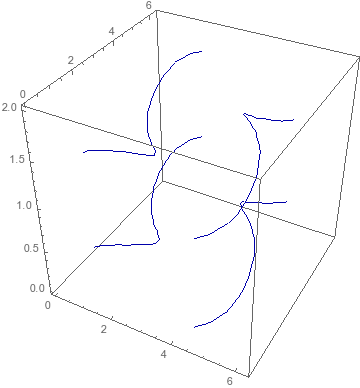
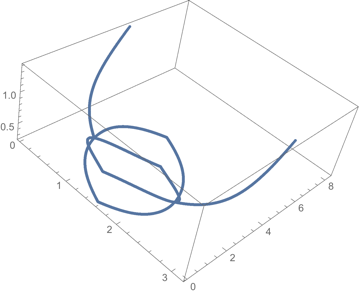
I would like to plot the solution space $\{\theta,\varphi,\Omega\}$ of this vector equation,
$$\begin{pmatrix} \sin (\theta ) \sin (\varphi ) \sin (2 \pi \Omega )-\sin (2 \theta ) \cos (\varphi ) \sin ^2(\pi \Omega )\\ -2 \sin (\theta ) \sin (\pi \Omega ) (\cos (\theta ) \sin (\varphi ) \sin (\pi \Omega )+\cos (\varphi ) \cos (\pi \Omega )) \\ -\sin ^2(\theta ) \cos (2 \pi \Omega )-\cos ^2(\theta ) \end{pmatrix} = \begin{pmatrix} 0 \\ 1 \\ 0 \end{pmatrix}$$
In mathematica I tried to use Solve and use ParametricPlot3D,
Solve[
  {-Cos[φ] Sin[2 θ] Sin[π Ω]^2 + Sin[θ] Sin[φ] Sin[2 π Ω],
   -2 Sin[θ] Sin[π Ω] (Cos[φ] Cos[π Ω] + Cos[θ] Sin[φ] Sin[π Ω]),
   -Cos[θ]^2 - Cos[2 π Ω] Sin[θ]^2} == {0,1,0},{θ, φ, Ω}]
However, Solve gives me too many solutions (including complex) such that I don't have a simple way to handle them.
I roughly know that the solution space should be a spiral curve.
In general, given such a vector equation, how would I plot the solution space in 3D?

