10
$\begingroup$

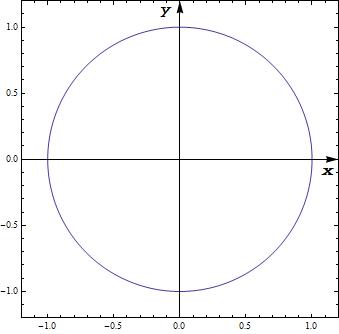
I have a 2D parametric plot like the following:

ParametricPlot[
  {Sin[t], Cos[t]}, {t, 0, 2 π},
  Frame -> True, AxesLabel -> {x, y}, 
  AxesStyle -> Arrowheads[0.04], PlotRangePadding -> 0.2
]

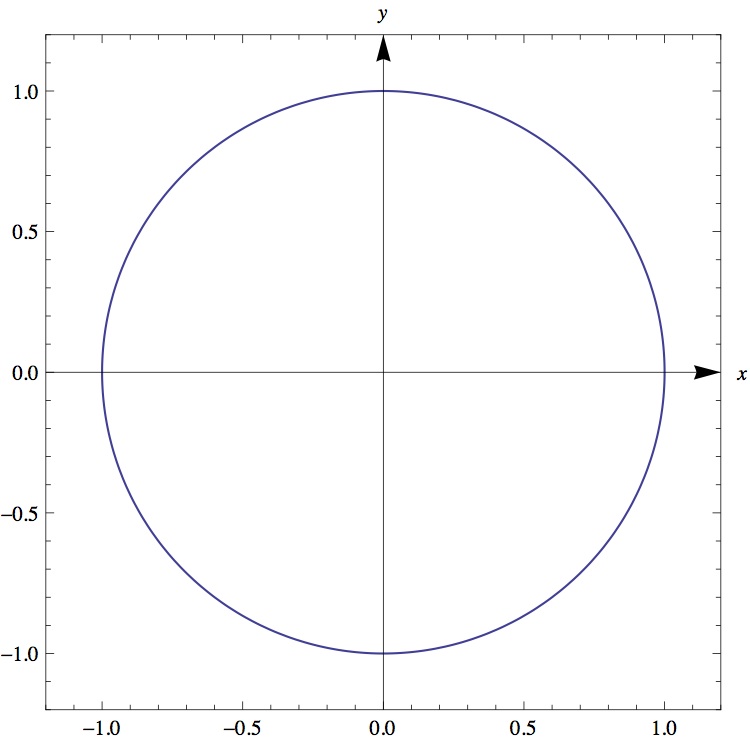
wrong labels

But I would like the axes labels x, y to be positioned besides the arrowheads (i.e. y left of the vertical arrowhead and x just below the horizontal one).

Since I can't use the frame as a replacement for the axes (as the axes are in the middle, not at the edge), I believe I cannot use the approach suggested in this question.

How could I achieve this?

$\endgroup$
0

4 Answers 4

9
$\begingroup$

You could "abuse" Arrowheads for this purpose; it has the advantage of tracking the axes wherever they may roam. Here is a utility function toArrowheads:

toArrowheads[{x_, y_}, head_, size_: 0.015, xos_: {-3, -3}, yos_: {-3, 3}] := 
  {Arrowheads[{{size, 1, Graphics[{head, Inset[x, xos]}]}}], 
   Arrowheads[{{size, 1, Graphics[{head, Inset[y ~Rotate~ (-90 °), yos]}]}}]}

The first parameter is a list with supplemental "x" and "y" labels which may be arbitrary expressions. The second parameter is the base arrowhead graphic. The next three parameters are optional and control the size of the arrowhead and the offset of the "x" and "y" labels.

In use:

head = Polygon[{{-3, 1}, {0, 0}, {-3, -1}, {-2.2, 0}}];

ParametricPlot[{Sin[t], Cos[t]}, {t, 0, 2 π},
  Frame -> True,
  AxesStyle -> toArrowheads[Style[#, 20] & /@ {"x", "y"}, head],
  PlotRangePadding -> 0.2,
  PlotRange -> {-0.8, 1.2},
  AxesOrigin -> {-0.1, 0.3}
]

enter image description here

$\endgroup$
3
  • $\begingroup$ Nice, I had the same idea but I didn't know how to attach the label to Arrowhead. This time I've missed "Details and Options" :) $\endgroup$
    – Kuba
    Commented Sep 6, 2013 at 9:53
  • $\begingroup$ works great, thanks a lot for this! $\endgroup$
    – Bernd
    Commented Sep 6, 2013 at 10:24
  • $\begingroup$ @Mr.Wizard I really like your method too, but I have an issue since I'm trying to use it to put labels either in the inside or in the outside of the plot area. When I put them outside (i.e. positive x offset), sometimes the labels appear "cut", since there is no extra room allocated for them (as is when using AxesLabel). Do you think this can be easily addressed? I've been trying to add some extra space putting things like Spacer in AxesLabel in addition to this, but things get messy quickly, and am finding hard to fit it neatly since AxesLabel offsetting doesn't appear consistent. $\endgroup$
    – abcd
    Commented Sep 2, 2020 at 5:09
8
$\begingroup$

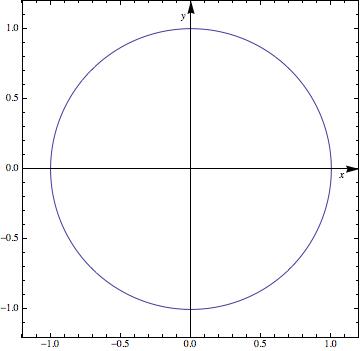
You could use Epilog to put the labels there manually:

ParametricPlot[{Sin[t], Cos[t]}, {t, 0, 2 \[Pi]}, Frame -> True, 
    AxesStyle -> Arrowheads[0.04], PlotRangePadding -> 0.2, 
    Epilog -> {Inset["x", Scaled[{0.95, 0.48}]], Inset["y", Scaled[{0.48, 0.95}]]}]

I used Scaled so it doesn't matter how large the circle is (and works well with PlotRangePadding).
enter image description here

Asymmetrical Version - not yet profoundly tested

Based on Mr. Wizards comments, I thought about asymmetrical ideas. He showed how to "abuse" the arrowheads - I'll try something different here (note that the code can be optimized, but I keep it rather extensive to show what I was thinking):

What I do: I get the PlotRange, AxesOrigin and PlotRangePadding and calculate the position:

doPP[pp_] :=
   Module[{plotRange, plotRangePadding, axes, offset},
     plotRange = Extract[pp, Most /@ Position[pp, PlotRange]][[1, 2]];
     plotRangePadding = {-Abs@#, Abs@#} &@
        Extract[pp, Most /@ Position[pp,   PlotRangePadding]][[1, 2]];
     axes = Reverse@Extract[pp, Most /@ Position[pp, AxesOrigin]][[1, 2]];
     offset = 
        Rescale[#1, #2] & @@@ Transpose[{axes, plotRangePadding + # & /@ plotRange}];
     Show[pp, 
        Epilog -> {Inset["x", Scaled[{ 0.95, offset[[1]] - 0.02}]], 
                   Inset["y", Scaled[{offset[[2]] - 0.02, 0.95}]]}]]

where you can customize 0.02 and 0.95 to your liking (or set as options, parameters).

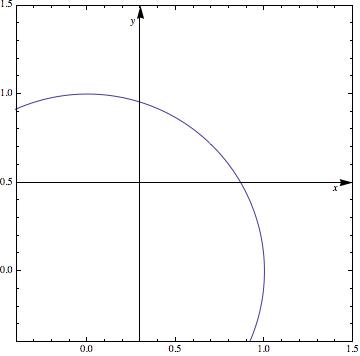
We can execute now:

ParametricPlot[{Sin[t], Cos[t]}, {t, 0, 2 \[Pi]}, Frame -> True, 
    AxesStyle -> Arrowheads[0.04], PlotRangePadding -> 0.2, 
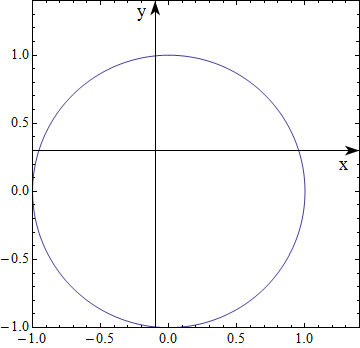
    AxesOrigin -> {0.3, 0.5}, PlotRange -> {-0.2, 1.3}] // doPP
enter image description here

$\endgroup$
5
  • 2
    $\begingroup$ Could you perhaps address positioning with non-centered axes from either e.g. AxesOrigin -> {-0.3, 0.5} or PlotRange -> {-0.2, 1.3}? (+1 of course) $\endgroup$
    – Mr.Wizard
    Commented Sep 6, 2013 at 9:20
  • $\begingroup$ 3D variation mathematica.stackexchange.com/a/27004/5478 $\endgroup$
    – Kuba
    Commented Sep 6, 2013 at 9:25
  • $\begingroup$ thanks for the input, @Mr.Wizard! You make it sound like there is an obvious/easy way to do it... I tried something, see my edited answer. If there is something smarter, feel free to add/edit/new-answer :) $\endgroup$ Commented Sep 6, 2013 at 9:57
  • $\begingroup$ @Pinguin No, nothing easy or obvious that I could think of; I gave my own method below. $\endgroup$
    – Mr.Wizard
    Commented Sep 6, 2013 at 9:57
  • $\begingroup$ @Mr.Wizard: ok cool, I like your approach - my idea (should it prove to be stable) works without arrowheads, at least one advantage... $\endgroup$ Commented Sep 6, 2013 at 9:59
4
$\begingroup$

Here's another way, based on this answer by Alexey Popkov. It is a little slower than the others due to Rasterize, but it handles asymmetrical axes positions. One could also use Offset instead of {3.5, 2.} to handle offsetting the labels, or make the offsets arguments to labelaxes.

labelaxes[plot_, {xlabel_, ylabel_}] := 
 Module[{xlim, ylim, orig}, 
  Rasterize[
   Show[plot, Frame -> False, Ticks -> {(xlim = {##}) &, (ylim = {##}) &}], 
   ImageResolution -> 1];
  orig = AxesOrigin /. AbsoluteOptions[plot, AxesOrigin];
  Show[plot,
   Graphics[{
     Text[TraditionalForm[xlabel], {xlim[[2]], orig[[2]]}, {3.5, 2.}], 
     Text[TraditionalForm[ylabel], {orig[[1]], ylim[[2]]}, {3.5, 2.}]}]
   ]
  ]


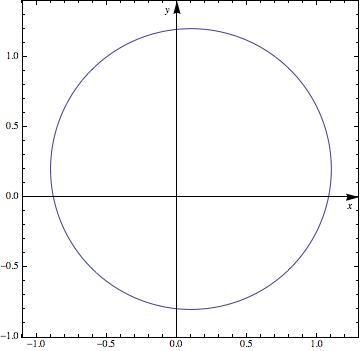
labelaxes[
 ParametricPlot[{Sin[t], Cos[t]} + {0.1, 0.2}, {t, 0, 2 Pi},
  Frame -> True, AxesStyle -> Arrowheads[0.04], PlotRangePadding -> 0.2], {x, y}]

Mathematica graphics

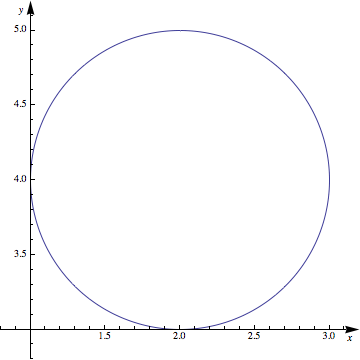
I suppress the frame so that the axes will be shown:

labelaxes[
 ParametricPlot[{Sin[t], Cos[t]} + {2, 4}, {t, 0, 2 Pi},
  (*Frame -> True,*) AxesStyle -> Arrowheads[0.04], PlotRangePadding -> 0.2], {x, y}]

Mathematica graphics

$\endgroup$
1
$\begingroup$

You can also use PlotLegends + Placed to place the axes labels:

ParametricPlot[{Sin[t], Cos[t]}, {t, 0, 2 π}, Frame -> True, 
 PlotLegends -> {Placed[Style[x, FontSize->[email protected], Italic, Bold], Scaled@{.97, .46}],
  Placed[Style[y, FontSize -> Scaled[.05], Italic, Bold], Scaled@{.46, .97}]}, 
 AxesStyle -> Arrowheads[0.04],  PlotRangePadding -> 0.2]

enter image description here

$\endgroup$

Your Answer

By clicking “Post Your Answer”, you agree to our terms of service and acknowledge you have read our privacy policy.

Not the answer you're looking for? Browse other questions tagged or ask your own question.