4
$\begingroup$

I would like to plot the following data and set the labels of the point not above, not below, but at an angle -let us say 45degree- with respect to the axis. What is a straightforward approach?

data2plot={Callout[{5,45},2.1`,Above,LeaderSize->24],Callout[{3.1,42},1.6`,Above,LeaderSize->24],Callout[{2,41},1.1`,Above,LeaderSize->24],Callout[{1,30},3.1`,Above,LeaderSize->24],Callout[{2.2`,47},1.9`,Above,LeaderSize->24],Callout[{11.4`,29.2`},4.3`,Above,LeaderSize->24]};

ListPlot[data2plot]
$\endgroup$
1
  • $\begingroup$ I am not sure about specifying the angle, but you can surely specify the co-ordinates of where the label appears. For example instead of Callout[{2, 41}, 1.1, Above, LeaderSize -> 24], tryCallout[{2, 41}, 1.1, {1.5, 42}, LeaderSize -> 24] where {1,5,42} specifies the co-ordinates of the label 1.1 $\endgroup$
    – Lotus
    Commented Jul 5, 2019 at 7:55

1 Answer 1

7
$\begingroup$

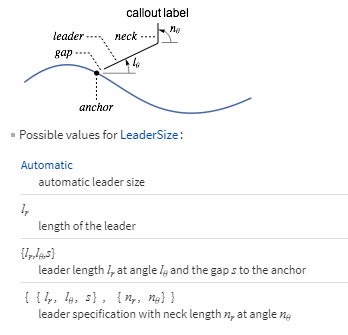
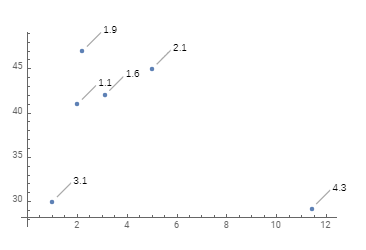
Change Above to Automatic and use LeaderSize -> {{length, angle, gap}, neck}:

data2plotb = data2plot /.  Callout[a_, b_, ___] :> 
    Callout[a, b, Automatic, LeaderSize -> {{24, 45 Degree,5}, 0}]

ListPlot[data2plotb, ImagePadding -> Scaled[.05]]
enter image description here

If your data and labels come in two lists you can use MapThread to construct a list of Callouts:

data = {{5, 45}, {3.1, 42}, {2, 41}, {1, 30}, {2.2, 47}, {11.4, 29.2}} ;
labels = {2.1, 1.6, 1.1, 3.1, 1.9, 4.3} ;
data4plotting = MapThread[Callout[##, Automatic, 
     LeaderSize -> {{24, 45 Degree, 5}, 0}] &, 
   {data, labels}];
ListPlot[data4plotting, ImagePadding -> Scaled[.05]]

same picture

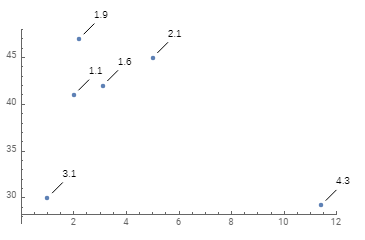
You might also consider using Epilog to add the labels and the connecting lines:

epilog = {MapThread[Text[#2, Offset[{15, 15}, #], {Left, Bottom}] &, {data, labels}], 
    Line[{ Offset[{5, 5}, #], Offset[{15, 15}, #]}] & /@ data};

ListPlot[data, Epilog -> epilog, 
  ImagePadding -> Scaled[.05], PlotRangeClipping -> False, 
  PlotRange -> {{0, 12}, All}]
enter image description here

Note: LeaderSize >> Details:

enter image description here

$\endgroup$
3
  • $\begingroup$ Will this translate to a Latex code? $\endgroup$ Commented Jul 5, 2019 at 9:00
  • $\begingroup$ @JoseEnriqueCalderon, I don't have any idea if/how it does. $\endgroup$
    – kglr
    Commented Jul 5, 2019 at 9:09
  • 1
    $\begingroup$ @Luigi - Assuming that your original data looks like data = {{5, 45, 2.1}, {3.1, 42, 1.6}, {2, 41, 1.1}, {1, 30, 3.1}, {2.2, 47, 1.9}, {11.4, 29.2, 4.3}}; The definition of data2plot can be simplified to data2plot = Callout[Most@#, Last@#, Automatic, LeaderSize -> {{24, 45 Degree, 5}, 0}] & /@ data; $\endgroup$
    – Bob Hanlon
    Commented Jul 5, 2019 at 12:40

Your Answer

By clicking “Post Your Answer”, you agree to our terms of service and acknowledge you have read our privacy policy.

Not the answer you're looking for? Browse other questions tagged or ask your own question.