1
$\begingroup$

The simplest way to see what the post's title is trying to convey is to evaluate:

{"-0.5",
  Text[Style["-0.5", FontFamily -> $DefaultFont[[1]],
           FontSize -> $DefaultFont[[2]]]]}

On my Windows 7 laptop, at least, the first 0.5 looks larger than the second one. (The first one looks "right" to me somehow).

My understanding is that $DefaultFont specifies the default output font, so I'm puzzled by the obvious difference (illustrated by this example) between text using the default output font, and text using a font explicitly set to match $DefaultFont (i.e., the first and second elements in the output of the evaluation above).

Clearly my understanding is wrong somewhere, but I can't figure it out.

Ultimately, I'm looking for a reliable way to specify the font size and font family of text elements in Graphics generated by Plot, etc.

FWIW, I'm using version 9.0.1.0.

$\endgroup$
1
  • 2
    $\begingroup$ $DefaultFont is obsolete, and if you change it substantially (both family and size, e.g. $DefaultFont={"Times", 20};), you will see that the output does not use it at all. To style plot texts, use the Plot options LabelStyle, FrameTicksStyle, DefaultStyle, BaseStyle, etc. $\endgroup$ Commented Sep 5, 2013 at 21:06

1 Answer 1

3
$\begingroup$

As István Zachar noted in his comment, $DefaultFont is deprecated. Setting the BaseStyle option is the way to go. For example. I frequently set the following options.

SetOptions[Graphics, BaseStyle -> {FontFamily -> "Helvetica", Bold}];
SetOptions[Plot, BaseStyle -> {FontFamily -> "Helvetica", Bold}];

Note, I don't monkey with font size. I prefer to let Mathematica vary font size as it sees fit.

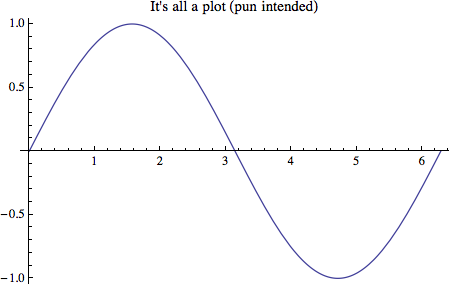
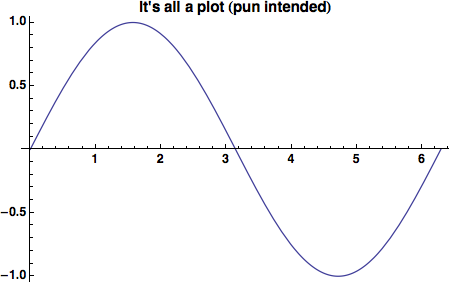
Now let's look at what difference setting BaseStyle makes in the case of a simple plot.

SetOptions[Plot, BaseStyle -> {}];
Plot[Sin[x], {x, 0, 2 Pi}, PlotLabel -> "It's all a plot (pun intended)"]

SinPlot.1.png

SetOptions[Plot, BaseStyle -> {FontFamily -> "Helvetica", Bold}];
Plot[Sin[x], {x, 0, 2 Pi}, PlotLabel -> "It's all a plot (pun intended)"]

SinPlot.2.png

Note that BaseStyle affects all the text in the plot, even the tick labels.

$\endgroup$

Your Answer

By clicking “Post Your Answer”, you agree to our terms of service and acknowledge you have read our privacy policy.

Not the answer you're looking for? Browse other questions tagged or ask your own question.