11
$\begingroup$

I am not at all a computer graphics expert, but it seems that portable document format (PDF) files have a "native size," even though they may (and usually do!) contain vector graphics that can be scaled essentially infinitely without loss of quality.

In Mathematica, the ImageSize option in graphics and plotting commands like Graphics, Plot, and ListPlot allows one to specify the size of images such as graphics and plots. One way to use the ImageSize option is to simply specify a width $w$. The image will be given that width and the image's height will be automatically chosen so as to maintain the image's AspectRatio (which, for plots, has the default 1/GoldenRatio).

Now, in the documentation for ImageSize (see the Details section), it is stated that one possible specification for width $w$ (and for height $h$) is $72 di$, which specifies $di$ inches (before magnification), according to the Documentation. This means that if I want an image (for example, a ListPlot) to be $di$ inches in width, I just need to use the option ImageSize -> (72*di) within the ListPlot. (I'm not certain, but it may be necessary to round the result to an integer, since I'm not sure if ImageSize accepts fractional/decimal arguments. If so, then I can just use ImageSize -> Round[72*di]).

So here's an example. Suppose that I'm told by a publisher that my image should be 8 inches wide. So I use ImageSize -> (72*8) in ListPlot. Then I customize my ListPlot in a variety of ways: I use the BaseStyle option to set the font size and family and I use Disk[] shapes as the PlotMarkers. I play with the parameters until my plot looks nice. For example:

xdata = Range[0, 0.05, 0.00115];
ydata = Sin[160*xdata];

pmSize = 10;(* size of PlotMarkers *)
pm = Graphics[{Red, Disk[]}, ImageSize -> pmSize];(* PlotMarkers *)

imgSizeInInches = 8;
imgSizeInPixels = Round[72*imgSizeInInches];(* ImageSize *)

pl = ListPlot[Transpose[{xdata, ydata}],
  PlotRange -> {-1.1, 1.1},
  Frame -> True,
  FrameLabel -> {"x (unit)", "y (unit)"},
  FrameStyle -> Thickness[Medium],
  AxesStyle -> Thickness[Medium],
  BaseStyle -> {26, FontFamily -> "Arial"},
  PlotMarkers -> pm,
  ImageSize -> imgSizeInPixels]

which gives this output:
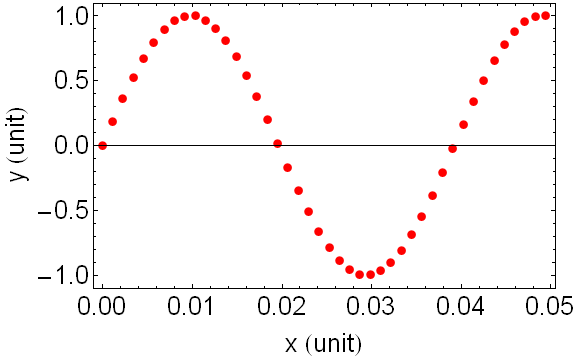
FirstOutput

Now I export to a PDF file called "example.pdf":

Export["example.pdf", pl, "AllowRasterization" -> False]

I open this PDF in Adobe Acrobat. Adobe Acrobat tells me (see the status bar at the bottom left) that, as promised, the image is 8 inches wide:
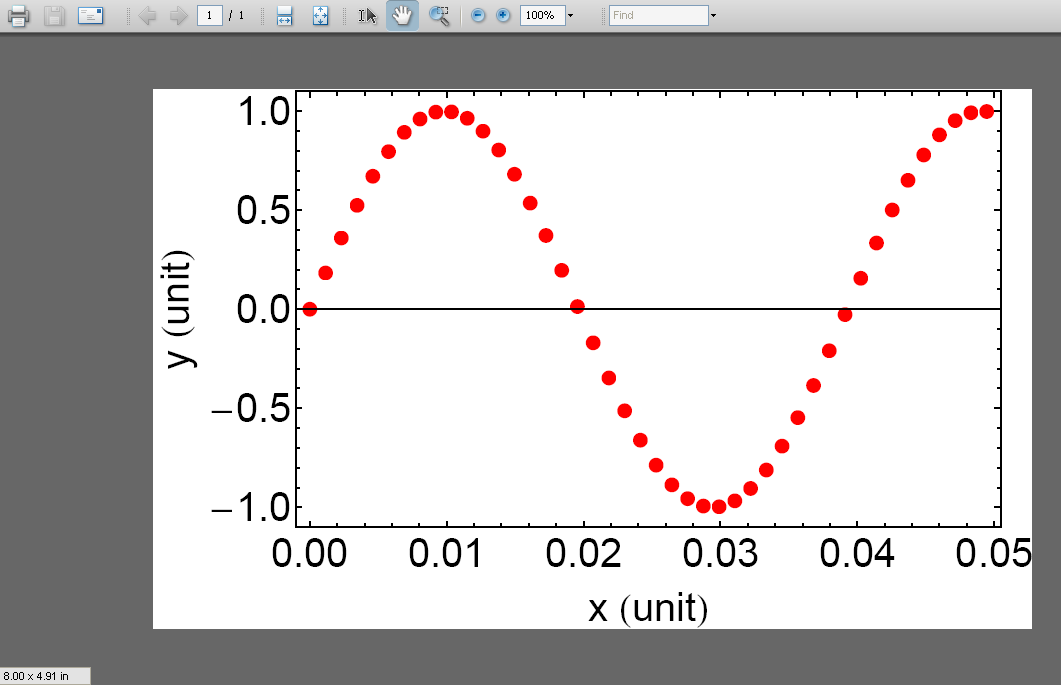
PDFImage

Yea! I am pleased, and so is my publisher: the PDF file's native size is 8 inches wide!

Now, however, suppose that the publisher changes its mind and now wants the PDF image to be natively 5 inches wide instead. My first thought is to simply set ImageSize to 72*5. That will make the width of the image 5 inches. I do this by simply setting imgSizeInInches = 5; in my code:

xdata = Range[0, 0.05, 0.00115];
ydata = Sin[160*xdata];

pmSize = 10;(* size of PlotMarkers *)
pm = Graphics[{Red, Disk[]}, ImageSize -> pmSize];(* PlotMarkers *)

imgSizeInInches = 5;
imgSizeInPixels = Round[72*imgSizeInInches];(* ImageSize *)

pl = ListPlot[Transpose[{xdata, ydata}],
  PlotRange -> {-1.1, 1.1},
  Frame -> True,
  FrameLabel -> {"x (unit)", "y (unit)"},
  FrameStyle -> Thickness[Medium],
  AxesStyle -> Thickness[Medium],
  BaseStyle -> {26, FontFamily -> "Arial"},
  PlotMarkers -> pm,
  ImageSize -> imgSizeInPixels]

...which gives this output:
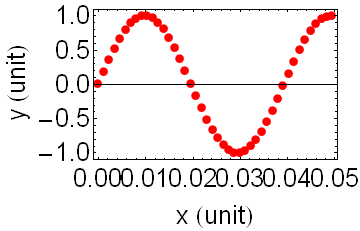
SecondOutput

When I export to a PDF file using Export["example.pdf", pl, "AllowRasterization" -> False] and open the resulting file in Adobe Acrobat, Adobe Acrobat confirms that the native width of the image is 5 inches:
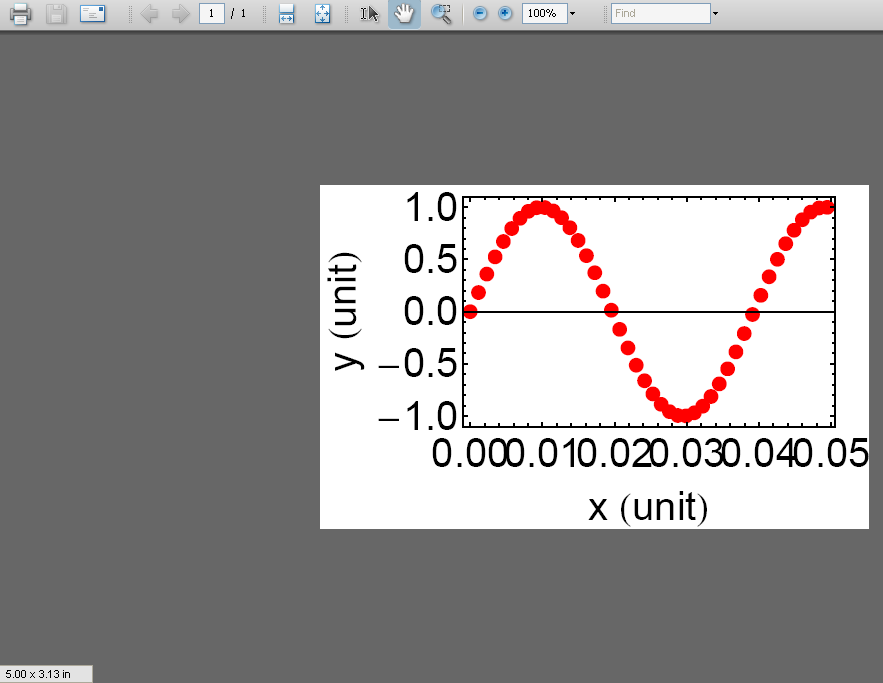
NewOut

But now the image is crammed -- the size of the image decreased, but the sizes of the font and the plot markers did not.

So, my question is: is there any way to simply scale the image so that the PDF file's "native" size decreases while also proportionally decreasing the size of the text, plot markers, etc? In that way, the entire image would "shrink" proportionally -- although without loss of quality since the image is a vector graphic!

Please not that I do not want to rasterize the image; I would like to keep the image as a vector graphic. Thank you for any help you can give with this confusing issue.

$\endgroup$
5
  • 1
    $\begingroup$ If the font size was ok in the first plot and then you made the second plot 5/8 the width why not try that on the font size. $\endgroup$ Commented Oct 28, 2013 at 1:57
  • 2
    $\begingroup$ You might want to look at these two related questions: Q1, Q2 $\endgroup$
    – m_goldberg
    Commented Oct 28, 2013 at 2:05
  • 2
    $\begingroup$ Also check out the documentation for Magnify. $\endgroup$
    – Verbeia
    Commented Oct 28, 2013 at 4:49
  • 2
    $\begingroup$ Related: mathematica.stackexchange.com/q/5442/131 $\endgroup$
    – Yves Klett
    Commented Oct 28, 2013 at 8:00
  • $\begingroup$ Related: (2475) $\endgroup$
    – Mr.Wizard
    Commented Aug 7, 2016 at 15:30

1 Answer 1

8
$\begingroup$

Magnification and Magnify

You can use the Magnification option for magnifying the whole graphics:

Style[pl, Magnification -> 5/8]
Export["example2.pdf", Style[pl, Magnification -> 5/8]]

You could also try Magnify:

Export["example3.pdf", Magnify[pl, 5/8]]

Note that Magnify is affected by the global Magnification option which you can access by Options[$FrontEnd, Magnification]. To get consistent result when you have non-default value of this option you could set it locally:

Export["example3.pdf", Style[Magnify[pl, 5/8], Magnification -> 1]]

Both ways are not perfect: you can notice slight "floating" of the frame labels. In this case Magnify gives almost identical result to Magnification (you can notice difference in thickness of the Frame) but there were cases when Magnify worked incorrectly. So you should try both ways.

I have tried also to use Inset for scaling but unfortunately it works identical to ImageSize.


Scaled functionality

Another possibility is to use Scaled font size and scaled sizes for plot markers from the start (note that I renamed your imgSizeInPixels variable to imgSizeInPoints because it is PostScript points, not pixels):

xdata = Range[0, 0.05, 0.00115];
ydata = Sin[160*xdata];

pmSize = .04;(*scaled size of PlotMarkers*)
pm = Graphics[{Red, Disk[]}];(*PlotMarkers*)
imgSizeInInches = 8;
imgSizeInPoints = Round[72*imgSizeInInches];(*ImageSize*)

pl = 
 ListPlot[Transpose[{xdata, ydata}], PlotRange -> {-1.1, 1.1}, 
  Frame -> True, FrameLabel -> {"x (unit)", "y (unit)"}, 
  FrameStyle -> Thickness[Medium], AxesStyle -> Thickness[Medium], 
  BaseStyle -> {FontSize -> Scaled[1/30], FontFamily -> "Arial"}, 
  PlotMarkers -> {pm, pmSize}, ImageSize -> imgSizeInPoints, 
  ImagePadding -> {{45, 20}, {40, 1}}]

Note that I have to set explicit ImagePadding because behavior of default ImagePadding -> All is incorrect in this case (clearly it is a bug). Now you can set any ImageSize you like while preserving the original appearance of the plot with exceptions for "floating" frame labels (seems to be another bug), non-scalable tick marks and the need to specify explicit ImagePadding for every ImageSize (AFAIK it is not possible to specify scaled ImagePadding).


Your own scaling functionality implementation

Given that Scaled functionality for FontSize is very buggy and ImagePadding is gedanken, I suggest to implement needed scaling functionality by yourself directly based on your imgSizeInInches variable.

Here is an example:

xdata = Range[0, 0.05, 0.00115];
ydata = Sin[160*xdata];

imgSizeInInches = 5;
pmSize = 1.25*imgSizeInInches;(*size of PlotMarkers*)
pm = Graphics[{Red, Disk[]}, ImageSize -> pmSize];(*PlotMarkers*)
imgSizeInPoints = Round[72*imgSizeInInches];(*ImageSize*)

pl = 
 ListPlot[Transpose[{xdata, ydata}], PlotRange -> {-1.1, 1.1}, 
  Frame -> True, FrameLabel -> {"x (unit)", "y (unit)"}, 
  FrameStyle -> Thickness[.001], AxesStyle -> Thickness[.001], 
  BaseStyle -> {FontSize -> 3.25*imgSizeInInches, 
    FontFamily -> "Arial"}, PlotMarkers -> pm, 
  ImageSize -> imgSizeInPoints, 
  ImagePadding -> (imgSizeInInches*{{12, 2.5}, {9, .1}})]

Changing imgSizeInInches scales the plot almost correctly but frame labels still float relatively to frame tick labels and tick marks still have fixed lengths and do not scale with the plot. The workaround for the latter is to use the CustomTicks package for automatic generation of scalable Ticks specification. One possible workaround for frame labels may be to use Framed instead of FrameLabel (have not tried it myself).

$\endgroup$
9
  • $\begingroup$ Thanks so much! I experienced a strange issue when trying your suggestions of Magnification and Magnify above. When I enter Export["example2.pdf", Style[pl, Magnification -> 5/8]], Adobe Acrobat says that the resulting example2.pdf has a width of 5 inches -- as expected and intended! But, when I enter Export["example3.pdf", Magnify[pl, 5/8]], Adobe Acrobat says that the resulting example3.pdf has a width of 3.60 inches, which is unexpected and unintended. I tried restarting the kernel. Can anyone please try this and see if you can reproduce this issue? $\endgroup$
    – Andrew
    Commented Oct 28, 2013 at 14:40
  • 1
    $\begingroup$ @Andrew It depends on the global Magnification setting. If you evaluate SetOptions[$FrontEnd, Magnification -> 1], then Export["example3.pdf", Magnify[pl, 5/8]] gives expected result with width of 5 inches. You can mimic this behavior by Export["example3.pdf", Style[Magnify[pl, 5/8], Magnification -> 1]]. $\endgroup$ Commented Oct 29, 2013 at 8:46
  • $\begingroup$ Why is this post community wiki? Was this a case of automatic conversion, and I would you like me to remove it? $\endgroup$
    – Mr.Wizard
    Commented Aug 7, 2016 at 15:37
  • $\begingroup$ @Mr.Wizard It was auto-converted to CW, please convert it into a normal post if possible. $\endgroup$ Commented Aug 7, 2016 at 15:54
  • $\begingroup$ Done! $\phantom{}$ $\endgroup$
    – Mr.Wizard
    Commented Aug 7, 2016 at 16:17

Your Answer

By clicking “Post Your Answer”, you agree to our terms of service and acknowledge you have read our privacy policy.

Not the answer you're looking for? Browse other questions tagged or ask your own question.