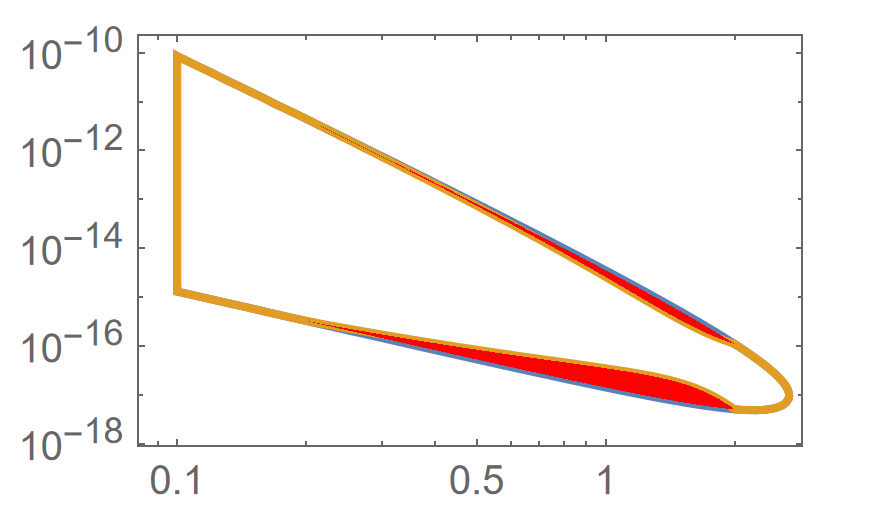
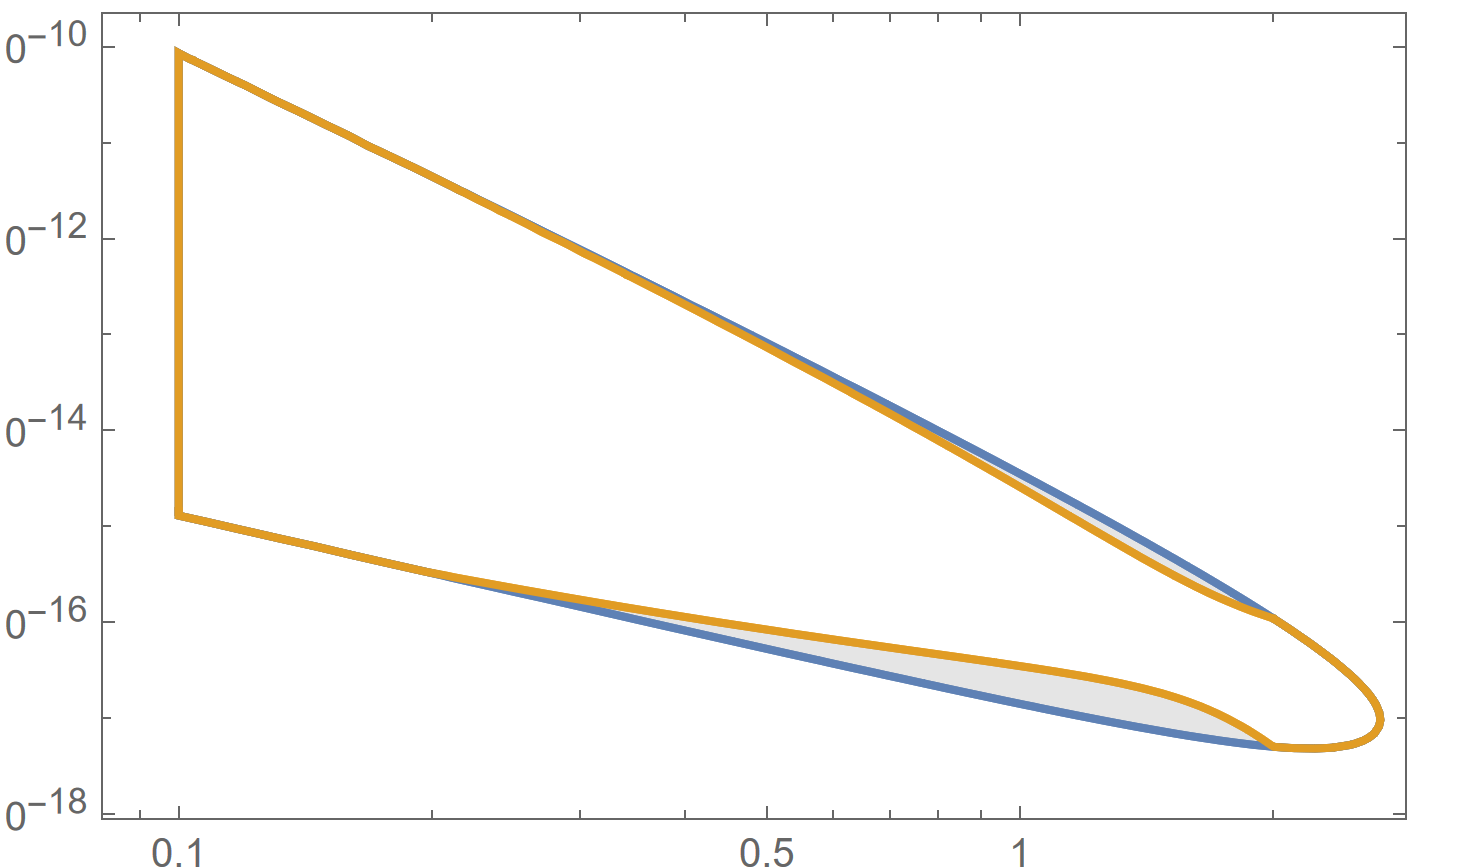
Consider the following curves:
Factor1[mX_, g2_] = 10^18 Sqrt[1 - mX^2/5^2]*g2;
ldecay[mX_, g2_] = (5.*10^-13)/(100*mX^4*g2);
lmin = 10;
lmax = 100;
Factor2[mX_, g2_] = Exp[-10/ldecay[mX, g2]] - Exp[-100/ldecay[mX, g2]];
ToyModification[mX_] =
  If[mX < 0.2 || mX > 2, 1, 1/Exp[2 (mX - 0.2) (2 - mX)]];
func1[mX_, g2_] =
  If[mX < 5, Evaluate[Factor1[mX, g2]*Factor2[mX, g2]], 0];
func2[mX_, g2_] =
  If[mX < 5,
   Evaluate[Factor1[mX, g2]*ToyModification[mX]*Factor2[mX, g2]], 0];
ToyRegions =
  RegionPlot[#[mX, 10^g2] >= 3, {mX, 0.1, 7}, {g2, -20, -7},
     PlotPoints -> 30] & /@ {func1, func2};
ToySensitivityCurves = {#[[1]], 10^#[[2]]} & /@
     Partition[
      Flatten[Cases[Normal@ToyRegions[[#]], Line[x_] :> x, Infinity]],
       2] & /@ {1, 2};
I would like to make a specific filling between the 1st and the 2nd curves in the domain where they are different. This is my attempt:
ListLogLogPlot[Evaluate[ToySensitivityCurves], Joined -> {True, True},
  Filling -> {2 -> {{1}, Directive[Gray, Opacity[0.2]]},1 -> {{2}, Directive[Gray, Opacity[0.2]]}},
 Frame -> True, FrameStyle -> Directive[Black, 25],
 PlotRange -> {{0.1, 7}, {10^-20, 10^-7}},
 PlotStyle -> {{Thickness[0.003], Blue}, {Thickness[0.003],
    Blue}, {Thickness[0.003], Darker@Darker@Green}, {Thickness[0.003],
     Darker@Gray}}, FrameStyle -> Directive[Black, 22],
 Joined -> {True, True, True, True, True}, AspectRatio -> 0.66,
 ImageSize -> Large, FrameLabel -> {"x", "y"},
 PlotLabel -> Style["func > 3", 22, Black]]
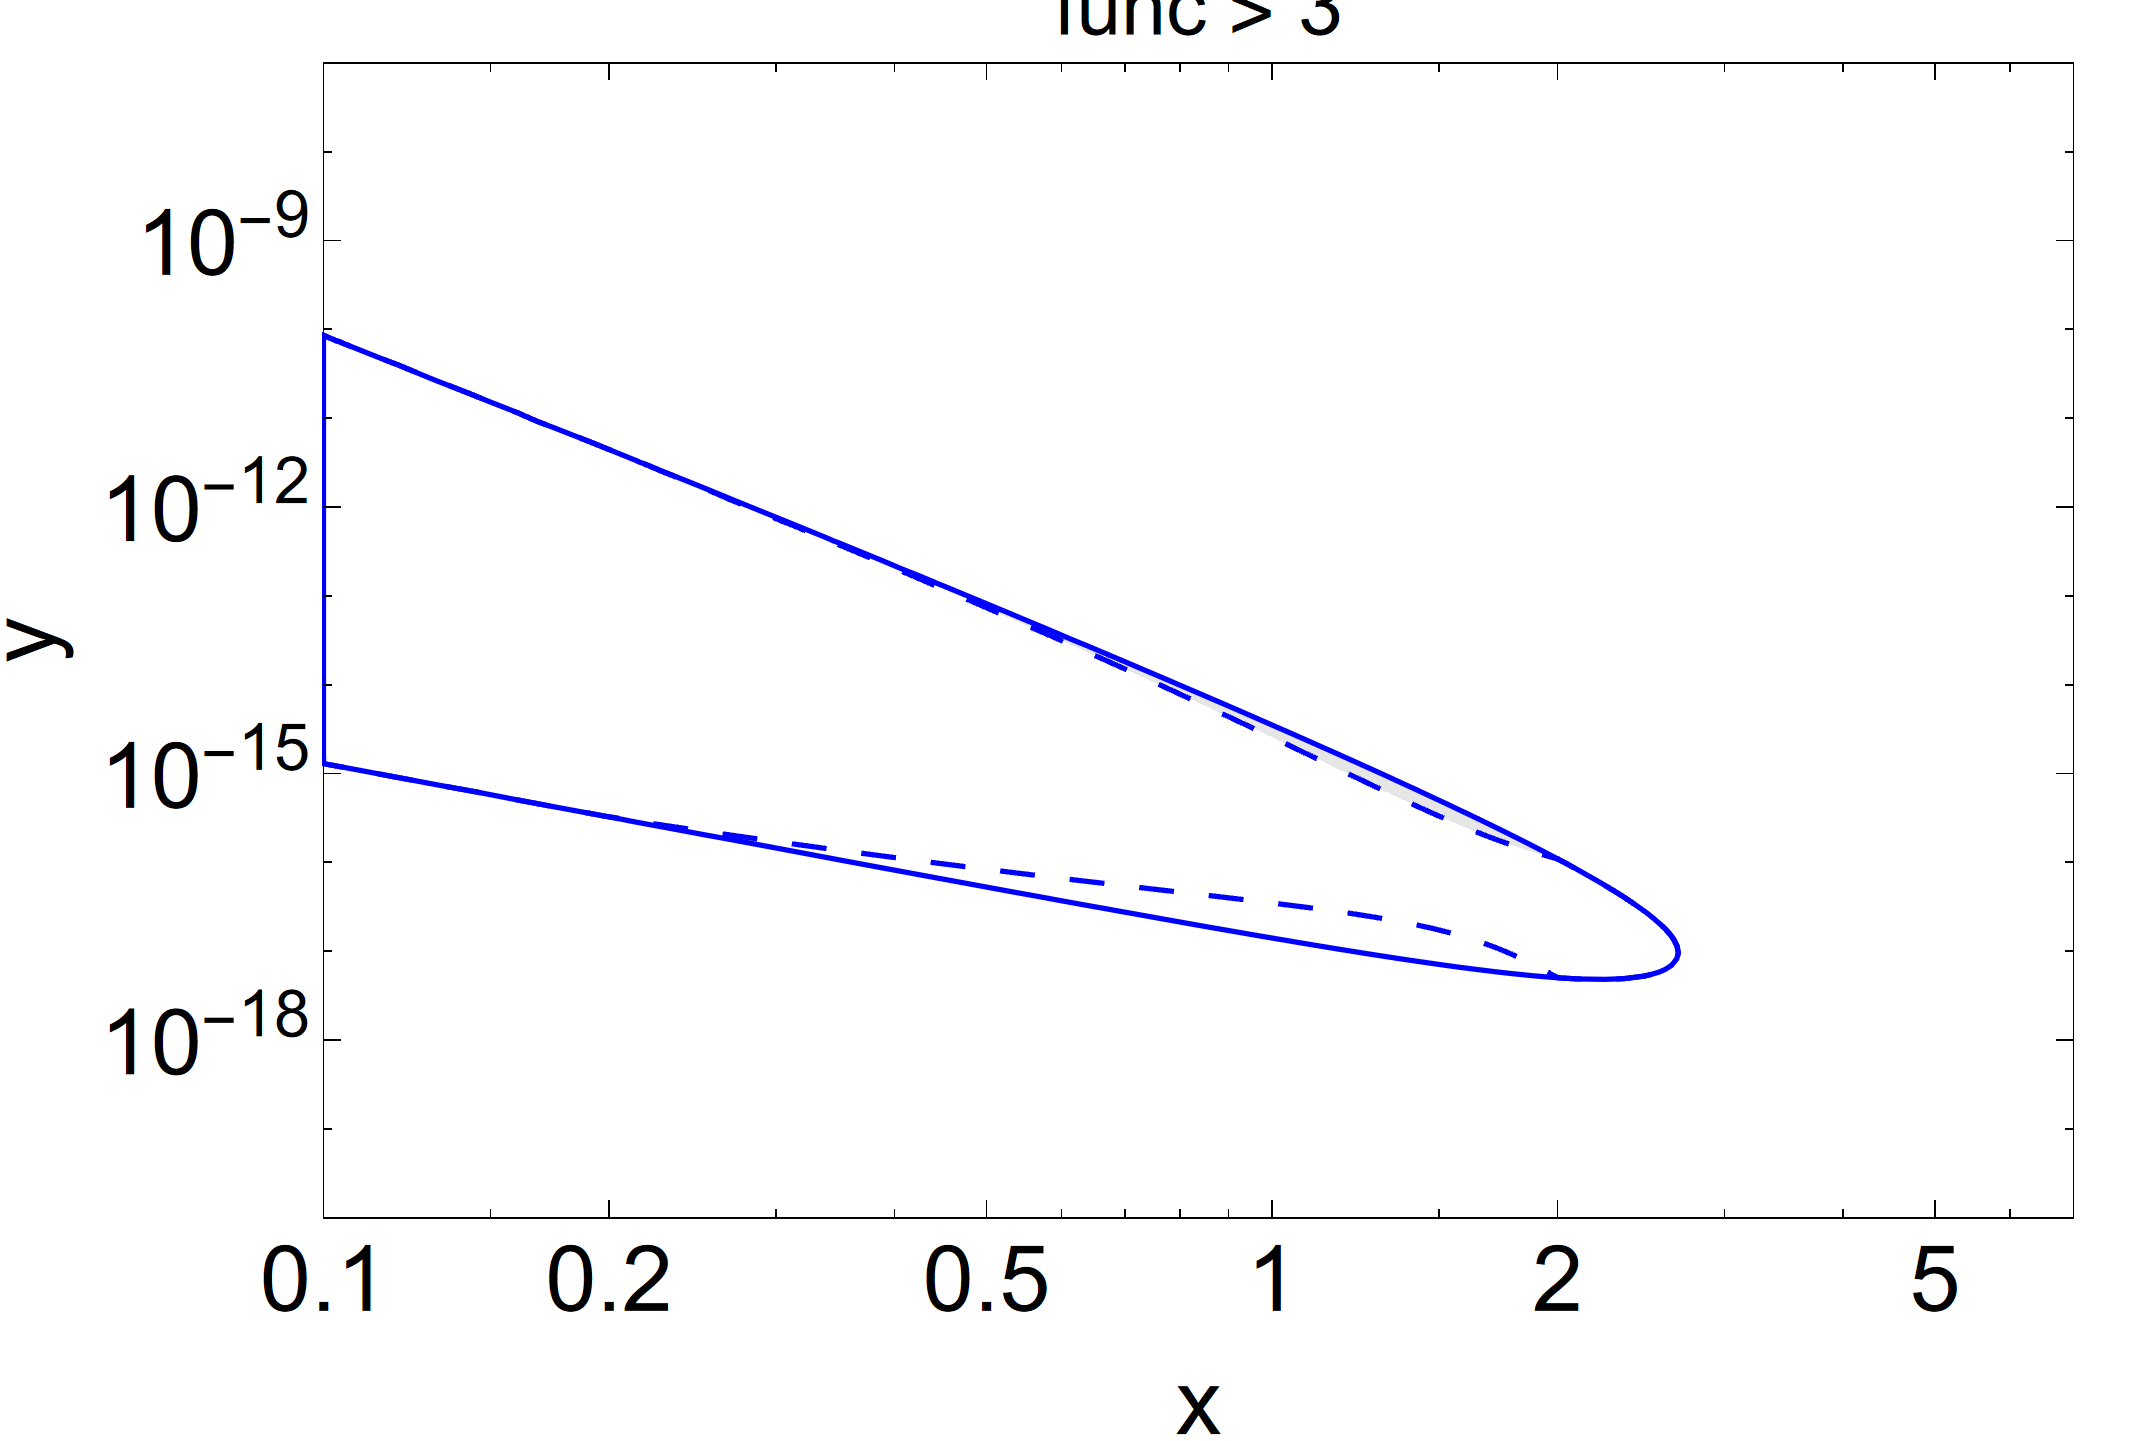
However, the filling only occurs at the upper boundary and not at the lower boundary:
Could you please tell me how to make the proper filling?


