3
$\begingroup$

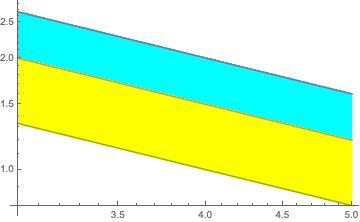
I want to make the filling between lines 2 and 3 semi-transparent so that the viewer can see there is another filling between lines 1 and 3 in the background. How can I do that? Thanks in advance.

LogLogPlot[{8/x, 6/x, 4/x}, {x, 3, 5}, Filling -> {{1 -> { {3}, Cyan}}, {2 -> { {3}, Yellow}}}]

enter image description here

$\endgroup$
1
  • 1
    $\begingroup$ You could replace Yellow with Directive[Yellow, Opacity[.4]], it ends up looking green though and isn't entirely clear it is transparent. $\endgroup$
    – Jason B.
    Commented Jan 19, 2023 at 16:04

1 Answer 1

5
$\begingroup$

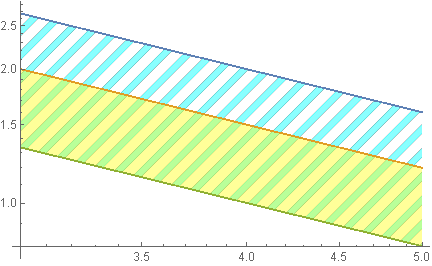
Colors interact with each other. A HatchFilling would provide more visual differentiation.

LogLogPlot[{8/x, 6/x, 4/x}, {x, 3, 5}
 , Filling -> {
   {1 -> {{3}, Directive[Lighter@Cyan, HatchFilling[π/4, 4, 14]]}}
   , {2 -> {{3}, Directive[Opacity[0.4], Yellow]}}
   }
 ]

enter image description here

$\endgroup$
2
  • 5
    $\begingroup$ +1 Note that Opacity can take a color without the need to use Directive, e.g., Opacity[0.4, Yellow] $\endgroup$
    – Bob Hanlon
    Commented Jan 19, 2023 at 16:15
  • $\begingroup$ Didn't know that, Thanks @BobHanlon. $\endgroup$
    – Syed
    Commented Jan 19, 2023 at 16:16

Your Answer

By clicking “Post Your Answer”, you agree to our terms of service and acknowledge you have read our privacy policy.

Not the answer you're looking for? Browse other questions tagged or ask your own question.