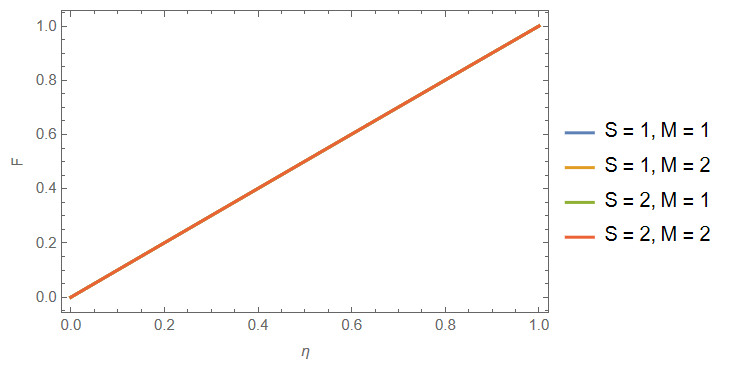
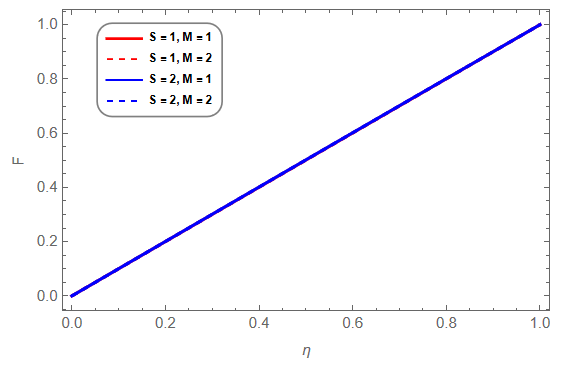
Since this problem has an exact solution $F=η$ for any M, S, we can't demonstrate effect of these parameters. Nevertheless, we can demonstrate code to plot several lines for different M,S as follows
sol[S_, M_] :=
 Module[{\[Gamma] = .4},
  s = NDSolve[{(1 + 1/\[Gamma]) F''''[\[Eta]] -
       S (\[Eta]*F[\[Eta]] + 3*F''[\[Eta]] + F'[\[Eta]]*F''[\[Eta]] -
          F[\[Eta]]*F'''[\[Eta]]) - M^2*F''[\[Eta]] == 0, F[0] == 0,
     F''[0] == 0, F[1] == 1, F''[1] == 0}, F, {\[Eta], 0, 1}]; s[[1]]]

Plot[Table[F[\[Eta]] /. sol[S, M], {S, {1, 2}}, {M, {1, 2}}] //
  Evaluate, {\[Eta], 0, 1},
 PlotLegends ->
  Flatten@Table[
    Row[{"S = ", S, ", M = ", M}], {S, {1, 2}}, {M, {1, 2}}],
 Frame -> True, FrameLabel -> {"\[Eta]", "F"}]

Update 1. To plot legends inside the frame with different stile use this code
frame[legend_] :=
 Framed[legend, FrameStyle -> Gray, RoundingRadius -> 10,
  FrameMargins -> 0, Background -> None]; style = {Red, {Red, Dashed},
   Blue, {Blue, Dashed}}; legend =
 Placed[LineLegend[
   Automatic, {"S = 1, M = 1", "S = 1, M = 2", "S = 2, M = 1",
    "S = 2, M = 2"}, LabelStyle -> {Bold, 8},
   LegendLayout -> "Column", LegendFunction -> frame,
   LegendMarkerSize -> {{25, 1.1}}], {0.2, 0.8}];

Plot[Table[F[\[Eta]] /. sol[S, M], {S, {1, 2}}, {M, {1, 2}}] //
  Evaluate, {\[Eta], 0, 1}, PlotStyle -> style, PlotLegends -> legend,
  Frame -> True, FrameLabel -> {"\[Eta]", "F"}]


M, S, therefore in the plot there are several lines $F=\eta$. Maybe you need another model to demonstrate effectS, M? $\endgroup$