1
$\begingroup$

I want to study the effect of S and M in the same figure, but I don't know how to do it.

M=1;\[Gamma]=.4;
sol[S_]:=NDSolve[{(1+1/\[Gamma]) F''''[\[Eta]]-S (\[Eta]*F[\[Eta]]+3*F''[\[Eta]]+F'[\[Eta]]*F''[\[Eta]]-F[\[Eta]]*F'''[\[Eta]])-M^2*F''[\[Eta]]==0,F[0]==0,F''[0]==0,F[1]==1,F''[1]==0},F,{\[Eta],0,1}]
Plot[Table[F[\[Eta]]/.First@sol[S],{S,{1,4,7,10,0,-1,-4,-7,-9,-12}}]//Evaluate,{\[Eta],0,1}] 
$\endgroup$
1
  • 1
    $\begingroup$ In this problem we have exact solution $F=\eta$ for any M, S, therefore in the plot there are several lines $F=\eta$. Maybe you need another model to demonstrate effect S, M ? $\endgroup$ Commented Aug 12 at 2:15

1 Answer 1

1
$\begingroup$

Since this problem has an exact solution $F=η$ for any M, S, we can't demonstrate effect of these parameters. Nevertheless, we can demonstrate code to plot several lines for different M,S as follows

sol[S_, M_] := 
 Module[{\[Gamma] = .4}, 
  s = NDSolve[{(1 + 1/\[Gamma]) F''''[\[Eta]] - 
       S (\[Eta]*F[\[Eta]] + 3*F''[\[Eta]] + F'[\[Eta]]*F''[\[Eta]] - 
          F[\[Eta]]*F'''[\[Eta]]) - M^2*F''[\[Eta]] == 0, F[0] == 0, 
     F''[0] == 0, F[1] == 1, F''[1] == 0}, F, {\[Eta], 0, 1}]; s[[1]]]

Plot[Table[F[\[Eta]] /. sol[S, M], {S, {1, 2}}, {M, {1, 2}}] // 
  Evaluate, {\[Eta], 0, 1}, 
 PlotLegends -> 
  Flatten@Table[
    Row[{"S = ", S, ", M = ", M}], {S, {1, 2}}, {M, {1, 2}}], 
 Frame -> True, FrameLabel -> {"\[Eta]", "F"}]
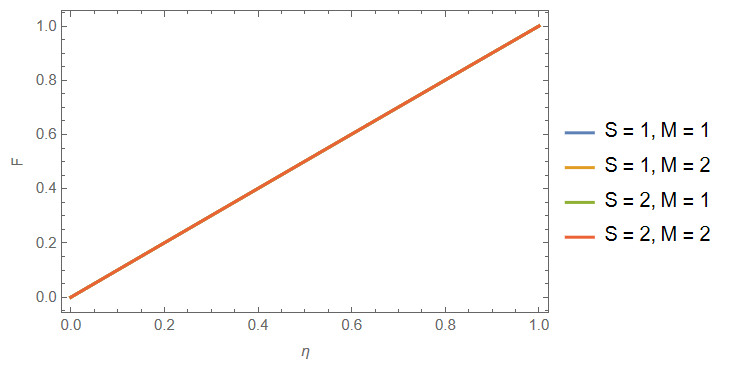
Figure 1

Update 1. To plot legends inside the frame with different stile use this code

frame[legend_] := 
 Framed[legend, FrameStyle -> Gray, RoundingRadius -> 10, 
  FrameMargins -> 0, Background -> None]; style = {Red, {Red, Dashed},
   Blue, {Blue, Dashed}}; legend = 
 Placed[LineLegend[
   Automatic, {"S = 1, M = 1", "S = 1, M = 2", "S = 2, M = 1", 
    "S = 2, M = 2"}, LabelStyle -> {Bold, 8}, 
   LegendLayout -> "Column", LegendFunction -> frame, 
   LegendMarkerSize -> {{25, 1.1}}], {0.2, 0.8}];

Plot[Table[F[\[Eta]] /. sol[S, M], {S, {1, 2}}, {M, {1, 2}}] // 
  Evaluate, {\[Eta], 0, 1}, PlotStyle -> style, PlotLegends -> legend,
  Frame -> True, FrameLabel -> {"\[Eta]", "F"}] 
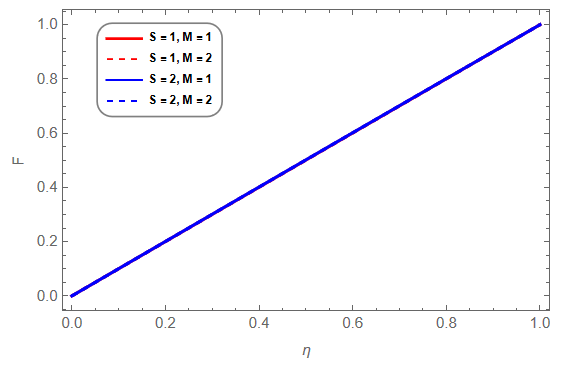
Figure 2

$\endgroup$
4
  • $\begingroup$ In the above code: How can I add a plot legend inside the figure? and how can I change some lines to dotted lines? $\endgroup$
    – ahmed
    Commented Aug 14 at 14:57
  • $\begingroup$ @ahmed Please, see Update 1. $\endgroup$ Commented Aug 14 at 16:30
  • $\begingroup$ The following errors appear: ReplaceAll::reps: {sol[1,1]} is neither a list of replacement rules nor a valid dispatch table, and so cannot be used for replacing. ReplaceAll::reps: {sol[1,2]} is neither a list of replacement rules nor a valid dispatch table, and so cannot be used for replacing. ReplaceAll::reps: {sol[2,1]} is neither a list of replacement rules nor a valid dispatch table, and so cannot be used for replacing. $\endgroup$
    – ahmed
    Commented Aug 15 at 8:13
  • 1
    $\begingroup$ @ahmed You should evaluate function sol[S_, M_] := Module[{\[Gamma] = .4}, s = NDSolve[{(1 + 1/\[Gamma]) F''''[\[Eta]] - S (\[Eta]*F[\[Eta]] + 3*F''[\[Eta]] + F'[\[Eta]]*F''[\[Eta]] - F[\[Eta]]*F'''[\[Eta]]) - M^2*F''[\[Eta]] == 0, F[0] == 0, F''[0] == 0, F[1] == 1, F''[1] == 0}, F, {\[Eta], 0, 1}]; s[[1]]] before using Plot. :) $\endgroup$ Commented Aug 16 at 6:29

Your Answer

By clicking “Post Your Answer”, you agree to our terms of service and acknowledge you have read our privacy policy.

Not the answer you're looking for? Browse other questions tagged or ask your own question.