2
$\begingroup$

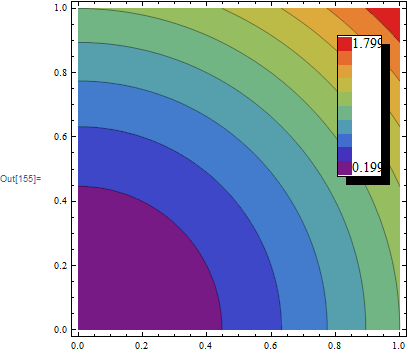
I have a ContourPlot where I have let Mathematica draw the contours automatically. I would like to extract the zmax and zmin contour values that have been determined internally so that I can pass them to ShowLegend to be shown with the color-bar. I am using Mathematica 8.

Needs["PlotLegends`"]
plTest = ContourPlot[xv^2 + yv^2, {xv, 0, 1}, {yv, 0, 1}, 
  Contours -> 9, ColorFunction -> "Rainbow"];
ShowLegend[plTest, {ColorData["Rainbow"][1 - #1] &, 10, "max", "min", 
  LegendPosition -> {0.6, 0}, BaseStyle -> {FontSize -> 14}}] 

I would like the actual zmax and zmin values to appear in the colorbar in the legend instead of the "max" and "min" above. Can someone please help me with this?

There is a similar post: ShowLegend values , but I can't get this to work with ContourPlot type. Thanks.

$\endgroup$
0

3 Answers 3

4
$\begingroup$

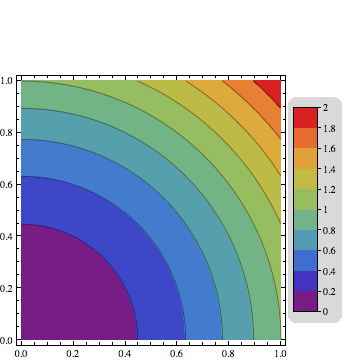
The question refers to my answer to "ShowLegend values" and mentions that it doesn't work with this plot. However, it does work.

The only thing is that for a ContourPlot, one may not want a smooth color gradient in the legend. I actually addressed that in a subsequent answer to "How can I label a ListDensityPlot with a color bar?".

So just follow the instructions in the last link, i.e., load the definitions from the first link and then change colorLegend as given in the second link.

With that, you could then do your plot as follows:

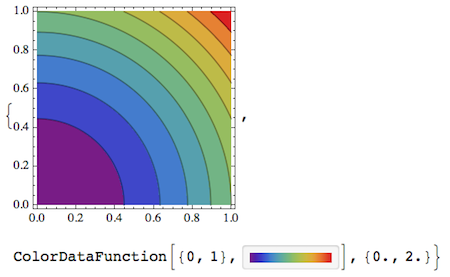
{plot, colors, range} = 
 reportColorRange[
  ContourPlot[xv^2 + yv^2, {xv, 0, 1}, {yv, 0, 1}, Contours -> 9, 
   ColorFunction -> "Rainbow"]]

colors

The last output is the specific answer to the question: it states the range {0, 2} as it was detected by reportColorRange. For legending purposes, it's important to realize that the contour values don't reflect the entire value range because the top and bottom of the range aren't drawn as contours. So post-processing only the drawn contours isn't the correct approach to make a legend. This is why I made the reportColorRange function which monitors what actually is calculated at the time the plot is done.

contour = 
 display[{plot // at[{0, 0}, .8], 
   colorLegend[colors, range, 11] // 
    at[{0.8, 0.1}, Scaled[{.15, 1.5}]]}]

plot

The third argument in colorLegend is the number of tick marks (including the bottom and top-most marks), so in this case for 9 contours it's 11 because the top and bottom of the range aren't drawn as contours.

$\endgroup$
6
  • $\begingroup$ Apologies, @Jens! Yes, as you claim your code indeed works with ContourPlot also. The reason I thought it doesn't work is because of the following peculiar thing: If I write plTest=ContourPlot[...]; reportColorRange[plTest] it does NOT work! However, if I do reportColorRange[ContourPlot[...]] it DOES work. I am puzzled... $\endgroup$
    – Shrihari
    Commented Aug 14, 2013 at 18:33
  • $\begingroup$ @Shrihari Yes, this is because reportColorRange has to look over Mathematica's shoulder while it's calculating the plot. So you have to always wrap the actual plot command by reportColorRange. When the plot is already done, it's too late to find out all the function values that have actually been encountered (to get the accurate max and min) - because only the function values at which contours are drawn will actually be kept, and that's not the correct min-max range. $\endgroup$
    – Jens
    Commented Aug 14, 2013 at 18:37
  • $\begingroup$ Ah, I see. Thanks for the nice implementation. It works fine for my actual plots also! $\endgroup$
    – Shrihari
    Commented Aug 14, 2013 at 19:12
  • $\begingroup$ Jens, based on your own description (and a quick skim) I think this question should be marked as a duplicate of (7531); do you disagree? $\endgroup$
    – Mr.Wizard
    Commented Aug 14, 2013 at 20:37
  • $\begingroup$ @Mr.Wizard I agree, now that the intention of the question has been fully clarified. $\endgroup$
    – Jens
    Commented Aug 14, 2013 at 21:41
2
$\begingroup$

The key to this is to look at the Graphics object returned by ContourPlot. Since the display is a side effect of formatting, we need to look at the InputForm of the object returned to prevent the formatting kicking in. (You could use FullForm, too, but it is much more difficult to extract meaningful information from it.) So, when you do that you will see something with this form

Graphics[ GraphicsComplex[{pts:{_, _}..},
 {layers:{{_EdgeForm, _RGBColor, GraphicsGroup[{__Polygon}]}..},
  contours:{Tooltip[{_Directive, _Line}, val_]..}}
 ],
 OptionsPattern[]
]

Don't worry if you don't immediately see that, I have been looking at these for a while, so I know how to look for the structures. From there, there are two ways one could conceivably approach getting the z-values used. First, you could extract the colors from the layers, and invert the color function to give you the corresponding z-value. Since "Rainbow" seems like it is a $1-1$ function, this is probably doable. It is not recommended, though, as an easier way exists: extract the values directly from the Tooltip in the contours. Simply,

Cases[plTest, Tooltip[{_Directive, _Line}, val_] :> val, Infinity]
(* {1.8, 1.6, 1.4, 1.2, 1, 0.8, 0.6, 0.4, 0.2} *)
$\endgroup$
9
  • $\begingroup$ Thanks @rcollyer . Sure enough, it works on this simple example that we have here. But when I try the Cases[...] line of yours on the actual ContourPlot that I have, I get a Null list, The ContourPlot options are all the same as in this simple example. I don't know how to replicate what I am doing in a simple example, since my code is quite long. Any suggestions? $\endgroup$
    – Shrihari
    Commented Aug 14, 2013 at 15:27
  • $\begingroup$ is that with or without running InputForm? If you've run InputForm, e.g. plTest = ContourPlot[...]//InputForm, then plTest is the input form, not the Graphics object. Without additional info, that is what I can come up with. You may have to look at the InputForm and see how it differs from the form I've described above. $\endgroup$
    – rcollyer
    Commented Aug 14, 2013 at 15:33
  • $\begingroup$ You're not finding the max and min values of the actually plotted function, just the extremal values of the drawn contours. This is not the same thing. $\endgroup$
    – Jens
    Commented Aug 14, 2013 at 17:54
  • $\begingroup$ @Jens you are correct that it isn't the min/max values of the function, but it does provide the min/max values of the contours, as specified by the OP. $\endgroup$
    – rcollyer
    Commented Aug 14, 2013 at 18:51
  • $\begingroup$ I don't think so. He wants the max and min that go into the color bar. The contours are the lines that divide the color bar, not including the extrema. $\endgroup$
    – Jens
    Commented Aug 14, 2013 at 18:58
1
$\begingroup$
ClearAll["Global`*"];
Needs["PlotLegends`"]

f[x_, y_] := x^2 + y^2;
plTest = ContourPlot[f[x, y], {x, 0, 1}, {y, 0, 1}, Contours -> 9, 
         ColorFunction -> "Rainbow"];

raw = Normal@ContourPlot[f[x, y], {x, 0, 1}, {y, 0, 1}, Contours -> 9];
points = Cases[raw, Line[pts_] :> pts, Infinity];
z = Join @@ points /. {x_, y_} :> f[x, y];

ShowLegend[plTest, {ColorData["Rainbow"][1 - #1] &, 10, 
  ToString[Max[z]], ToString[Min[z]], LegendPosition -> {0.6, 0}, 
  BaseStyle -> {FontSize -> 14}}]

Mathematica graphics

reference: This question

$\endgroup$
2
  • $\begingroup$ Ignore that last comment. I just read through your code. $\endgroup$
    – rcollyer
    Commented Aug 14, 2013 at 15:13
  • $\begingroup$ The range of values you detect from the drawn contours is not the correct range for the legend. See my answer. $\endgroup$
    – Jens
    Commented Aug 14, 2013 at 17:53

Not the answer you're looking for? Browse other questions tagged or ask your own question.