2
$\begingroup$

I'm looking for an implementation in Mathematica of the generalized circular function $\text{circ}(x, y; R, c)$ of radius $R$ and centre $c=(c_1,c_2)$ such that

$$\text{circ}(x, y; R, c)=\begin{cases}1 & \text{if }\sqrt{(x_1-c_1)^2+(x_2-c_2)^2}\le R, \\ 0 & \text{otherwise.} \end{cases} $$

In particular, I am interested in a form that allows me to compute the Fourier transform in terms of Bessel functions. What is a possible implementation?

$\endgroup$
6
  • 1
    $\begingroup$ Boole@RegionMember[Disk[{c1, c2}, R], {x1, x2}] $\endgroup$
    – Syed
    Commented Feb 13 at 15:46
  • $\begingroup$ @Syed How do you compute its transform? This doesn't depend on $x$ or $y$. $\endgroup$ Commented Feb 13 at 16:07
  • $\begingroup$ I think I don't understand the question. Please ignore. $\endgroup$
    – Syed
    Commented Feb 13 at 16:13
  • $\begingroup$ @Syed I want some function F[x1_,x_2,c_1,c_2,R] that is $1$ inside the circle (or on the circumference thereof), and $0$ elsewhere. There has to be an explicit dependence on the coordinates $x_1,x_2$, otherwise there would be no way to act on it with the Fourier transform (I think). $\endgroup$ Commented Feb 13 at 16:22
  • 1
    $\begingroup$ @DavidG.Stork True. $\endgroup$ Commented Feb 13 at 17:19

2 Answers 2

1
$\begingroup$

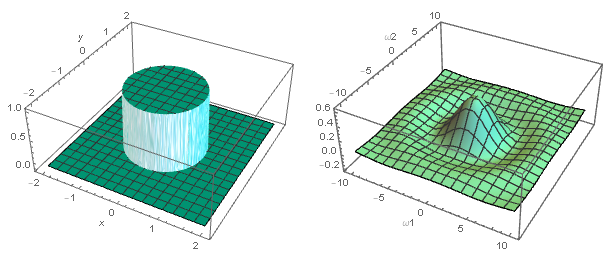
Here is another (hopefully better) attempt, but first tackle a simpler case as a demo of the workflow.

p1 = Plot3D[HeavisidePi[1/2 (x^2 + y^2)], {x, -2, 2}, {y, -2, 2}
   , PlotStyle -> Darker@Cyan
   , ImageSize -> 300
   , AxesLabel -> Automatic
   , Exclusions -> All
   , ExclusionsStyle -> HatchShading[.4, Darker@Cyan]
   , SphericalRegion -> True
   , PlotRangePadding -> Scaled[.05]
   ];

FourierTransform[
  FunctionExpand@HeavisidePi[1/2 (x^2 + y^2)], {x, 
   y}, {ω1, ω2}] // FunctionExpand

$\frac{I_1\left(\sqrt{-\text{$\omega $1}^2-\text{$\omega $2}^2}\right)}{\sqrt{-\text{$\omega $1}^2-\text{$\omega $2}^2}}$

p2 = Plot3D[BesselI[1, Sqrt[-ω1^2 - ω2^2]]/
   Sqrt[-ω1^2 - ω2^2]
   , {ω1, -10, 10}
   , {ω2, -10, 10}
   , PlotStyle -> ColorData["HTML", "Aquamarine"]
   , PlotRange -> {-0.2, 0.6}
   , ImageSize -> 300
   , AxesLabel -> Automatic
   , PlotPoints -> 20
   , MaxRecursion -> 2
   , SphericalRegion -> True
   , PlotRangePadding -> Scaled[.05]
   ];

Grid[{{p1, p2}}]

enter image description here


Comments on the more general case

Using a function with a disk of radius R and situated at an offset:

f[x_, y_, c1_, c2_, R_] := 
 UnitBox[(1/(2 R^2)) ((x - c1)^2 + (y - c2)^2)]

Instead of the HeavisidePi, I am using UnitBox as advised by @user64494 with a correction to the formula suggested by @UlrichNewmann. Thanks to both.


While computing the Fourier transform, this evaluates instantly but with c1=0 and c2=0. Note that the radius can be set differently.

FourierTransform[
  f[x, y, 0, 0, 1], {x, y}, {ω1, ω2}] // FunctionExpand

A workaround (check!) can be to add an offset to ω1 and ω2 after the transform calculation in order to shift the center of the 3D sinc-like plot. As an example:

FourierTransform[
   Evaluate@f[x, y, 0, 0, 3], {x, 
    y}, {ω1, ω2}] /. {ω1 -> ω1 - 
     1, ω2 -> ω2 - 1/2 } // FunctionExpand

I cannot comment on its math correctness so you can check or devise another strategy to evaluate the Fourier transform. I am not aware of such a strategy at this point. Perhaps the transform will evaluate after several minutes more and I haven't waited for more than five minutes on my machine before quitting the calculation.

$\endgroup$
7
  • $\begingroup$ The right function in this situation is UnitBox instead of HeavisidePi. The HeavisidePi is an attempt (which leaves much to be desired) to implement the certain distribution in Mathematica, whereas UnitBox is a usual function. $\endgroup$
    – user64494
    Commented Feb 14 at 8:20
  • $\begingroup$ Thanks @user64494. The Fourier transform exhibits the same difficulty with computation, but your point is taken. $\endgroup$
    – Syed
    Commented Feb 14 at 8:24
  • $\begingroup$ There is a bug in the two-dimensional FourierTransform: f[x_, y_, c1_, c2_, R_] := FunctionExpand@UnitStep[1/(2 R) ((x - c1)^2 + (y - c2)^2)];ourierTransform[ Evaluate@f[x, y, 0, 0, 3], {x, y}, {\[Omega]1, \[Omega]2}] produces 2 \[Pi] DiracDelta[\[Omega]1] DiracDelta[\[Omega]2] though this is a usual Fourier transform of a usual function. InverseFourierTransform[%, {\[Omega]1, \[Omega]2}, {x, y}] results in 1. $\endgroup$
    – user64494
    Commented Feb 14 at 8:31
  • $\begingroup$ [CASE:5115048] has been submitted by me. $\endgroup$
    – user64494
    Commented Feb 14 at 9:10
  • $\begingroup$ Many thanks, @user64494. $\endgroup$
    – Syed
    Commented Feb 14 at 9:13
1
$\begingroup$

Function definition

F[x1_, x2_, c1_, c2_, R_] := Which[  R >= 0 && (c1 - x1)^2 + (c2 - x2)^2 <= R^2, 1, True, 0]

Plot3D[F[x1, x2, 1, 1/2, 1], {x1, -1, 3}, {x2, -1, 2}  ]
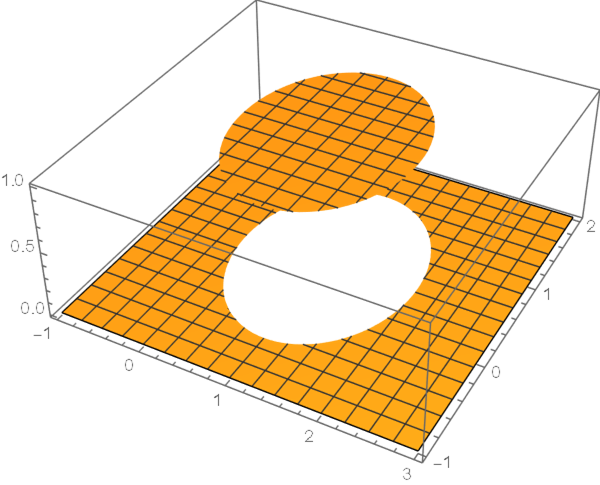
enter image description here

first addendum

Mathematica v12.2 evaluates wrong result for the Fouriertransform

FourierTransform[UnitStep[R^2 - (   (x1 - c1)^2 + (x2 - c2)^2  )] , {x1, x2}, {\[Omega]1, \[Omega]2}, 
Assumptions -> {Element[{R, c1, c2}, Reals], R > 0}]
(* 0 *)

Numerical evaluation of a special gives (takes some time...)

    With[{c1 = 1/2, c2 = 1/4, R = 1}, 
 reg = ImplicitRegion[(x1 - c1)^2 + (x2 - c2)^2 <= R^2, {x1, x2}];
 ft[\[Omega]1_?NumericQ, \[Omega]2_?NumericQ] := 
  1/(2 Pi) NIntegrate[
    UnitStep[R^2 - (   (x1 - c1)^2 + (x2 - c2)^2  )] Exp[
      I (x1 \[Omega]1 + x2 \[Omega]2 )], Element[{x1, x2}, reg] ];
  {Plot3D[Re@ft[om1, om2], {om1, -10, 10}, {om2, -10, 10}, 
   PlotRange -> All], 
  Plot3D[Im@ft[om1, om2], {om1, -10, 10}, {om2, -10, 10}, 
   PlotRange -> All]}]
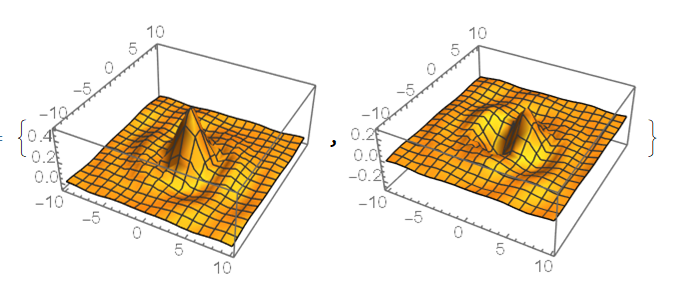
enter image description here

second addendum

Introducing polarcoordinates x1->c1+r Cos[phi],x2->c1+r Sin[phi] it is possible to evaluate the FourierTransform analytically

Fouriertransform 1/(2 Pi) \[Integral]Exp[I (x1 \[Omega]1 +x2 \[Omega]2 )] dx1 dx2 transforms to

ft= 1/(2 Pi) Integrate[r Exp[I  (   \[Omega]1 (c1 + r   Cos[\[CurlyPhi]]) + \[Omega]2 (c2 +r  Sin[\[CurlyPhi]]))], {r, 0, R}, {\[CurlyPhi], 0, 2 Pi}, 
Assumptions ->Element[{r, R, \[Omega]1, \[Omega]2}, Reals]] // Simplify

enter image description here

Result confirms the numerical example

With[{c1 = 1/2, c2 = 1/4, 
  R = 1},  {Plot3D[
   Re@(1/2 E^(I (c1 \[Omega]1 + c2 \[Omega]2))
       R^2 Hypergeometric0F1Regularized[
       2, -(1/4) R^2 (\[Omega]1^2 + \[Omega]2^2)]), {\[Omega]1, -10, 
    10}, {\[Omega]2, -10, 10}, PlotRange -> All], 
  Plot3D[Im@(1/2 E^(I (c1 \[Omega]1 + c2 \[Omega]2))
       R^2 Hypergeometric0F1Regularized[
       2, -(1/4) R^2 (\[Omega]1^2 + \[Omega]2^2)]), {\[Omega]1, -10, 
    10}, {\[Omega]2, -10, 10}, PlotRange -> All]}]
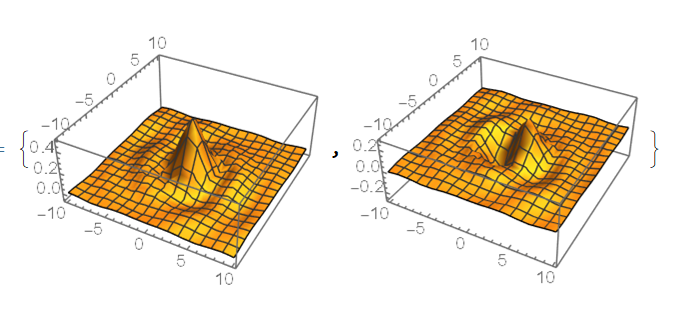
enter image description here

$\endgroup$
2
  • $\begingroup$ Nice solution. Do you also get the transform? My machine seems to have trouble with the computation. $\endgroup$ Commented Feb 13 at 20:52
  • $\begingroup$ @Noobgrammer I tried FourierTransform[ UnitStep[R^2 - ( (x1 - c1)^2 + (x2 - c2)^2 )] , {x1, x2}, {\[Omega]1, \[Omega]2}, Assumptions -> {Element[{R, c1, c2}, Reals], R > 0}] but Mathematica v12.2 evaluates wrong result 0! $\endgroup$ Commented Feb 14 at 10:34

Your Answer

By clicking “Post Your Answer”, you agree to our terms of service and acknowledge you have read our privacy policy.

Not the answer you're looking for? Browse other questions tagged or ask your own question.