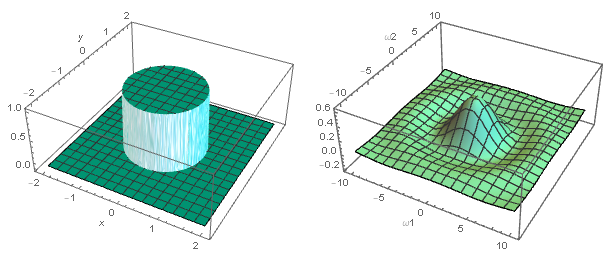
Here is another (hopefully better) attempt, but first tackle a simpler case as a demo of the workflow.
p1 = Plot3D[HeavisidePi[1/2 (x^2 + y^2)], {x, -2, 2}, {y, -2, 2}
, PlotStyle -> Darker@Cyan
, ImageSize -> 300
, AxesLabel -> Automatic
, Exclusions -> All
, ExclusionsStyle -> HatchShading[.4, Darker@Cyan]
, SphericalRegion -> True
, PlotRangePadding -> Scaled[.05]
];
FourierTransform[
FunctionExpand@HeavisidePi[1/2 (x^2 + y^2)], {x,
y}, {ω1, ω2}] // FunctionExpand
$\frac{I_1\left(\sqrt{-\text{$\omega $1}^2-\text{$\omega $2}^2}\right)}{\sqrt{-\text{$\omega $1}^2-\text{$\omega $2}^2}}$
p2 = Plot3D[BesselI[1, Sqrt[-ω1^2 - ω2^2]]/
Sqrt[-ω1^2 - ω2^2]
, {ω1, -10, 10}
, {ω2, -10, 10}
, PlotStyle -> ColorData["HTML", "Aquamarine"]
, PlotRange -> {-0.2, 0.6}
, ImageSize -> 300
, AxesLabel -> Automatic
, PlotPoints -> 20
, MaxRecursion -> 2
, SphericalRegion -> True
, PlotRangePadding -> Scaled[.05]
];
Grid[{{p1, p2}}]

Comments on the more general case
Using a function with a disk of radius R and situated at an offset:
f[x_, y_, c1_, c2_, R_] :=
 FunctionExpand@HeavisidePi[1/(2 R) ((x - c1)^2 + (y - c2)^2)]
While computing the Fourier transform, this evaluates instantly but with c1=0 and c2=0. Note that the radius can be set differently.
FourierTransform[
  f[x, y, 0, 0, 1], {x, y}, {ω1, ω2}] // FunctionExpand
A workaround (check!) can be to add an offset to ω1 and ω2 after the transform calculation in order to shift the center of the 3D sinc-like plot. As an example:
FourierTransform[
   Evaluate@f[x, y, 0, 0, 3], {x,
    y}, {ω1, ω2}] /. {ω1 -> ω1 -
     1, ω2 -> ω2 - 1/2 } // FunctionExpand
I cannot comment on its math correctness so you can check or devise another strategy to evaluate the Fourier transform. I am not aware of such a strategy at this point. Perhaps the transform will evaluate after several minutes more and I haven't waited for more than five minutes on my machine before quitting the calculation.

