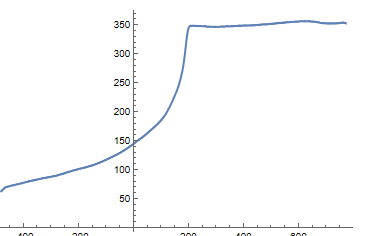
Rather than search for the largest slope change, might the problem be described as finding a "change point" where there is one function to the left of the point of change and another to the right of that point of change? Such an approach is labeled "change-point regression" or "segmented regression".
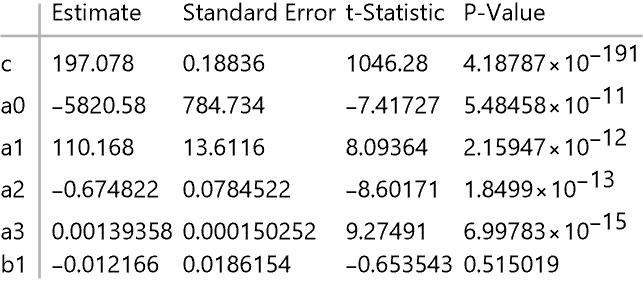
If there are reasonable models for both sides of the change point, one can also obtain standard errors and/or confidence intervals for the location of the change point. Also note that the estimate of the change point doesn't have to be one of the values in the data.
Consider your data with the predictor variable being between 150 and 250. Suppose there is a polynomial relationship of order 3 to the left of the change point ($c$) and a polynomial relationship of order 1 to the right of the change point. We have
$$f_\text{left}(x)=a_0+a_1 x+a_2 x^2 + a_3 x^3 + \text{error}$$
$$f_\text{right}(x)=b_0+b_1 x +\text{error}$$
We want the two functions to be the same value at $x=c$. We can force that with
$$a_0+a_1 c+a_2 c^2+a_3 c^3=b_0+b_1 c$$
Equivalently, we can let $b_0=a_0+a_1 c+a_2 c^2+a_3 c^3-b_1 c$. Here is Mathematica code to estimate the change point.
data = Uncompress[FromCharacterCode[Flatten[ImageData[Import["https://i.sstatic.net/CfCqf.png"], "Byte"]]]][[1]];
(* Just consider data with the predictor value being between 150 and 250 *)
data2 = Select[data, 150 < #[[1]] < 250 &];

(* Define a Piecewise function that has one function to the left of
   the cut-point and another to the right of the cut-point *)
f[x_, c_, a0_, a1_, a2_, a3_, b1_] :=
 Piecewise[{{a0 + a1 x + a2 x^2 + a3 x^3, x <= c},
  {(a0 + a1 c + a2 c^2 + a3 c^3 - b1 c) + b1 x, x > c}}]
nlm = NonlinearModelFit[data2, f[x, c, a0, a1, a2, a3, b1],
  {{c, 200}, {a0, 150}, {a1, 1}, {a2, 0.001}, {a3, 0.00001}, {b1, 0}}, x];

Show[ListPlot[data, PlotRange -> {{150, 250}, Automatic}, PlotStyle -> PointSize[0.02]],
 Plot[nlm[x], {x, Min[data2[[All, 1]]], Max[data2[[All, 1]]]}, PlotStyle -> Red]]
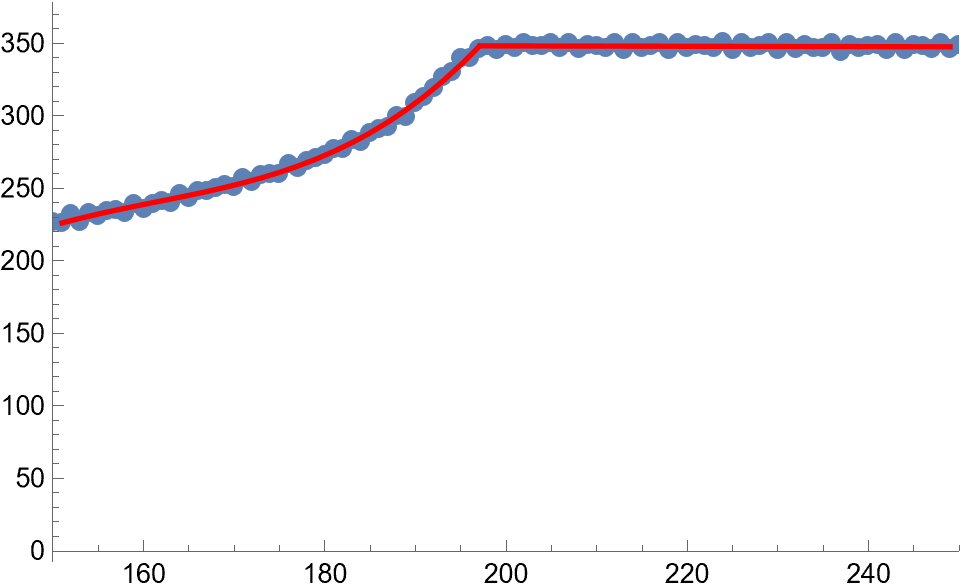
nlm["ParameterTable"]
The other answers so far are correct in that they find the "largest slope" with an associated value that occurs around 190. That I think you really want the change in function rather than a maximum slope can be seen by focusing in on the data:
ListPlot[data2, PlotRange -> {{185, 250}, {280, 360}}, PlotStyle -> PointSize[0.02]]
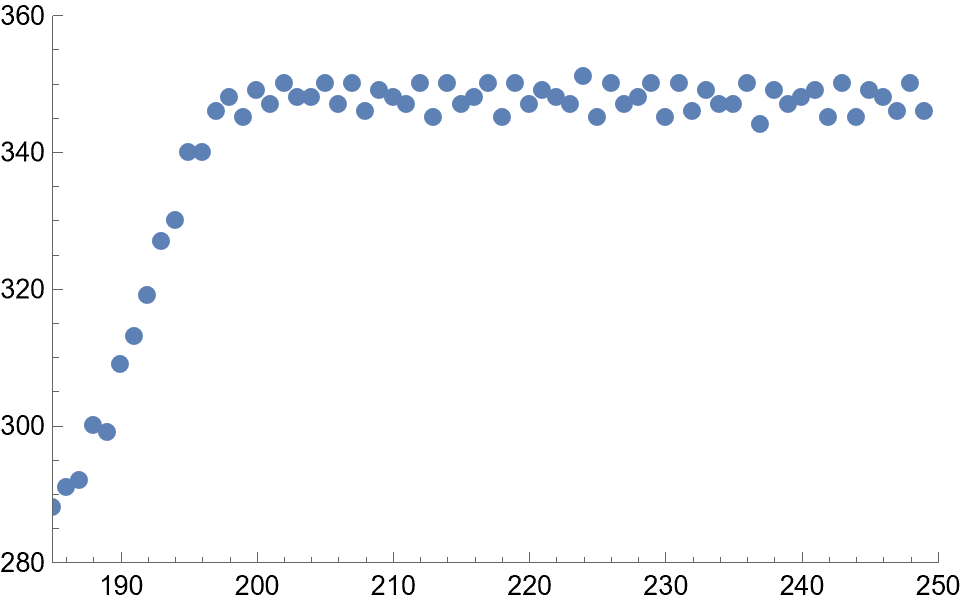
I don't see that a value of 190 gives a number that is appropriate for your data.

