This question is an extension of this question, if we change the initial values FindDistributionParameters[data1, dist, {{a, 0.1}, {b, 0.1}, {c,
0.1}, {al, 0.1}, {be, 0.1}, {ph, 0.1}}]
to FindDistributionParameters[data1, dist, {{a, 0.2}, {b, 0.1}, {c,
0.1}, {al, 0.1}, {be, 0.1}, {ph, 0.1}}] parameter estimates also change. So my question is if we have no idea about initial values then how we search best initial values or best MLE estimates which close to empirical distribution of data1.
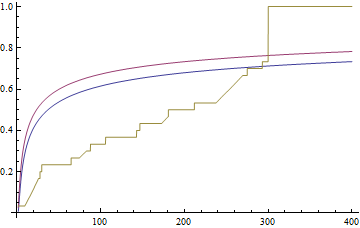
The empirical distribution with two parameters which are estimated with initial value's given above are plotted as

Not a best fit. The code of above plot is:
data1 = {275, 13, 147, 23, 181, 30, 65, 10, 300, 173, 106, 300, 300, 212, 300, 300, 300, 2, 261, 293, 88, 247, 28, 143, 300, 23, 300, 80, 245, 266}; g1 = NIntegrate[(2.51339*2.51952*3.21532)/Beta[2.87484, 0.0825351]* y^-(3.21532 + 1)*(1 + 0.0609138*2.51952*y^-3.21532)^-((2.87484*2.51339)/0.0609138 + 1)*(1 - (1 + 0.0609138*2.51952*y^-3.21532)^-(2.51339/ 0.0609138))^(0.0825351 - 1), {y, 0, x}];
g2 = NIntegrate[(1.98156*1.98026*3.2635)/Beta[2.64639, 0.090212]* y^-(3.2635 + 1)*(1 + 0.0328252*1.98026*y^-3.2635)^-((2.64639*1.98156)/0.0328252 + 1)*(1 - (1 + 0.0328252*1.98026*y^-3.2635)^-(1.98026/ 0.0328252))^(0.090212 - 1), {y, 0, x}];
Plot[{g1, g2, CDF[EmpiricalDistribution[data1], x]}, {x, 2, 400},
Exclusions -> None]
