2
$\begingroup$

I am trying to fit a non-standard PDF to data using FindDistributionParameters. My custom distribution is defined like this:

fs = Function[{so,l, n},
   TransformedDistribution[
    so - l/2 c,
    c \[Distributed] 
     NoncentralChiSquareDistribution[n, 2 so/l],
     Assumptions -> so > 0 && n > 0 && l > 0
    ]
   ];

My data corresponds to measurements of a variable on N individuals. For each individual I have multiple measurements to take into account the measurement error. My data is similar to this :

SeedRandom[1];
trueValue = RandomVariate[fs[so, l, n] /. {so -> 1, l -> 0.1, n -> 2}, 100];(* true value for each individual, which I don't know*)
errorSD = RandomVariate[ChiSquareDistribution[3], 100]/10; (*standard deviations of the measurment error for each individual*)

fullMeasurement = RandomVariate[NormalDistribution[#[[1]], #[[2]]], 5] & /@ Transpose[{trueValue, errorSD}];
myData = {Mean[#], StandardDeviation[#]} & /@ fullMeasurement(*Simulated data set similar to my real data*)

As a first approach, I used FindDistributionParameters on the mean of the measurements.

p = FindDistributionParameters[myData[[All,1]],
   fs[so, l, n],
   ParameterEstimator -> {"MaximumLikelihood", Method -> "NMaximize",
     MaxIterations -> 500, AccuracyGoal -> 5}];

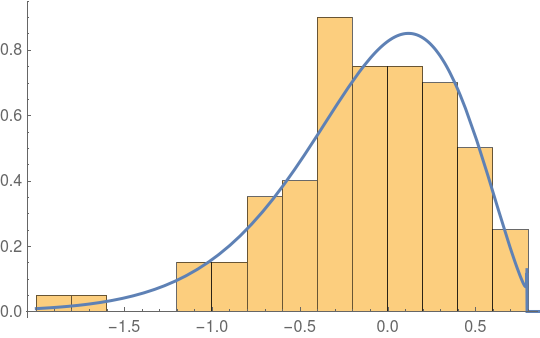
Show[
 Histogram[myData[[All,1]], 15, "ProbabilityDensity"],
 Plot[PDF[fs[so,l, n] /. p, x], {x, -2, 1}, PlotRange -> All, PlotStyle -> Thick]
 ]

Yellow : histogram of simulated data. Blue line : PDF of the custom distribution with the estimated parameters

However with this approach I am not using the information of the standard deviation of the measurements. As a second approach, assuming the error is normally distributed, I tried to make a convolution of my custom distribution and a normal distribution. I first tried to get the PDF of the convolution using either Convolve or directly integrating with Integrate but it did not work.

Then tried to use TransformedDistribution to create the convolution and use FindDistributionParameters:

fse = Function[{so, l, n, sd},
   TransformedDistribution[
    so - l/2 c + e,
    {c \[Distributed] NoncentralChiSquareDistribution[n, 2 so/l],
     e \[Distributed] NormalDistribution[0, sd]},
    Assumptions -> so > 0 && n > 0 && l > 0 && sd > 0
    ]
   ];

FindDistributionParameters[data,
  fse[so, l, n, sd] /. sd -> Mean[data[[All,2]]],
  ParameterEstimator -> {"MaximumLikelihood", Method -> "NMaximize", 
    MaxIterations -> 500, AccuracyGoal -> 5}];

However it runs indefinitely, and this approach is using only the mean of the standard deviations and not the value for each individual. Is their a better (and more efficient) way to include the measurement error in the estimation method ?


EDIT: Following @JimB comment, below is the code I used to try to estimate parameters with fse using data that were directly generated from it:

data = RandomVariate[fse[1, 0.1, 2, 0.01], 100];
FindDistributionParameters[data, fse[so, l, n, sd] /. sd -> 0.01, 
  ParameterEstimator -> {"MaximumLikelihood", Method -> "NMaximize", MaxIterations -> 500, AccuracyGoal -> 5}];

It also runs indefinitely

$\endgroup$
6
  • $\begingroup$ Random samples from fse are not the same as random samples from the approach to mimic your real data. Getting a random standard deviation from a chisquare distribution is either too complicated or you know a whole lot about your data. Why not just generate data from fse? $\endgroup$
    – JimB
    Commented Nov 1, 2019 at 4:48
  • $\begingroup$ @JimB Yes it is true. I drew the standard deviation (sd) from a Chisquare because I know that for a small sample size, the sampling distribution of the sd for a normally distributed variable is skewed to the right (and I chose the chi square arbitrarily, I could have taken a gamma). If I was using a higher sample size I could have used a normal sampling distribution for the sd (and then remove the few negative values). $\endgroup$
    – YoAn
    Commented Nov 1, 2019 at 8:19
  • $\begingroup$ I tried to generate data from fse but FindDistributionParameters does not work either on this data. Even thought, I know that fse is not the proper way to model my data because it is only using the mean of the standard deviation. Thanks for the comment. $\endgroup$
    – YoAn
    Commented Nov 1, 2019 at 8:20
  • $\begingroup$ I think you should re-think your ideas about the distribution of the "variance". It is the sampling distribution of the sample variance from a normal distribution (and not the actual variance $\sigma^2$ of the normal distribution) that is associated with a chisquare: $s^2\sim \sigma^2 \chi^2_{n-1}/(n-1)$. You might want to ask this question on CrossValidated to get approaches to incorporate measurement error and then come back here for implementation. $\endgroup$
    – JimB
    Commented Nov 1, 2019 at 13:05
  • $\begingroup$ Maybe my pst was not clear. Indeed it is the sampling distribution which is a chisquare. For each individual I am taking a sample of 5 measurements. I assume these measurements are normally distributed for each individual with a different mean and variance. So to generates the fake data I draw the true value from the distribution that I would like to fit. Then the mean of the normal distribution of error is assumed to be 0 for all individuals and the variance of this normal is drawn from the chisquare sampling distribution for each individual. $\endgroup$
    – YoAn
    Commented Nov 1, 2019 at 13:46

1 Answer 1

4
$\begingroup$

I led you astray with a bogus answer that I didn't think through appropriately. I've removed the previous answer and put in place a more correct approach. Here's what I missed: the variance associated with the added noise needs to be estimated with the replicate measurements. If just the mean of the replicates is used, then all of the information about the noise variance is essentially lost.

The Method of Moments will still work here. Standard errors could be obtained by bootstrapping. However, Mathematica complains if FindDistributionParameters is used because it can't determine the support of the distribution. Fortunately it is simple to still use the method of moments without FindDistributionParameters.

(* Define distributions *)
fs = Function[{so, l, n}, 
   TransformedDistribution[so - l/2 c, 
    c \[Distributed] NoncentralChiSquareDistribution[n, 2 so/l], 
    Assumptions -> so > 0 && n > 0 && l > 0]];

fse = Function[{so, l, n, σ}, 
   TransformedDistribution[so - l/2 c + e,
    {c \[Distributed] NoncentralChiSquareDistribution[n, 2 so/l], 
     e \[Distributed] NormalDistribution[0, σ/Sqrt[5]]}]];

(* Distribution of observed data with replicate measurments *)
fse2 = Function[{so, l, n, σ}, 
  TransformedDistribution[so - l/2 c + {e1, e2, e3, e4, e5}, 
  {c \[Distributed] NoncentralChiSquareDistribution[n, 2 so/l], 
  e1 \[Distributed] NormalDistribution[0, σ], e2 \[Distributed] NormalDistribution[0, σ], 
  e3 \[Distributed] NormalDistribution[0, σ], e4 \[Distributed] NormalDistribution[0, σ], 
  e5 \[Distributed] NormalDistribution[0, σ]}]];

Now generate data and estimate parameters.

(* Get data with replicate measurements *)
SeedRandom[1];
xx = RandomVariate[fse2[1, 0.1, 2, 1], 100];

(* Estimate standard deviation for replicates *)
sd = Mean[Variance[#] & /@ xx]^0.5
(* 0.98078 *)

(* Get mean for each set of replicates *)
x = Mean[#] & /@ xx;

(* Use method of moments where theoretical moments are set to the sample moments *)
mom = NSolve[{Mean[fse[so, l, n, sd]] == Mean[x],
    Variance[fse[so, l, n, sd]] == Variance[x],
    Skewness[fse[so, l, n, sd]] == Skewness[x]}, {so, l, n}];
(* Keep only the legitimate solutions *)
mom = Select[mom, (so /. # ) > 0 && (l /. #) > 0 && (n /. #) > 0 &] //
   Flatten
(* {so -> 0.847071, n -> 4.853, l -> 0.0808586} *)

(* Now plot observed histogram, theoretical pdf and estimated pdf *)
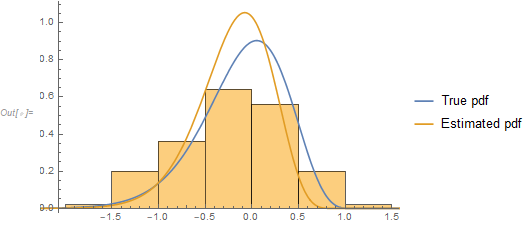
Show[Histogram[x, Automatic, "PDF"], 
 Plot[{PDF[fs[1, 0.1, 2], z], PDF[fs[so, l, n, sd] /. mom, z]}, {z, -3, 2}]]

Histogram of replicate means and true and estimated pdfs

$\endgroup$
2
  • $\begingroup$ Thank you for your help. Indeed using the MethodOfMoments with starting values works perfectly and run really fast. I will also compute the likelihood numerically as you suggested and try it with FindMaximum. $\endgroup$
    – YoAn
    Commented Nov 1, 2019 at 17:49
  • $\begingroup$ If you get the numerical likelihood approach working, you should add that as an answer and choose that as the accepted answer (as that's what you asked for in the first place). $\endgroup$
    – JimB
    Commented Nov 2, 2019 at 18:05

Your Answer

By clicking “Post Your Answer”, you agree to our terms of service and acknowledge you have read our privacy policy.

Not the answer you're looking for? Browse other questions tagged or ask your own question.