6
$\begingroup$

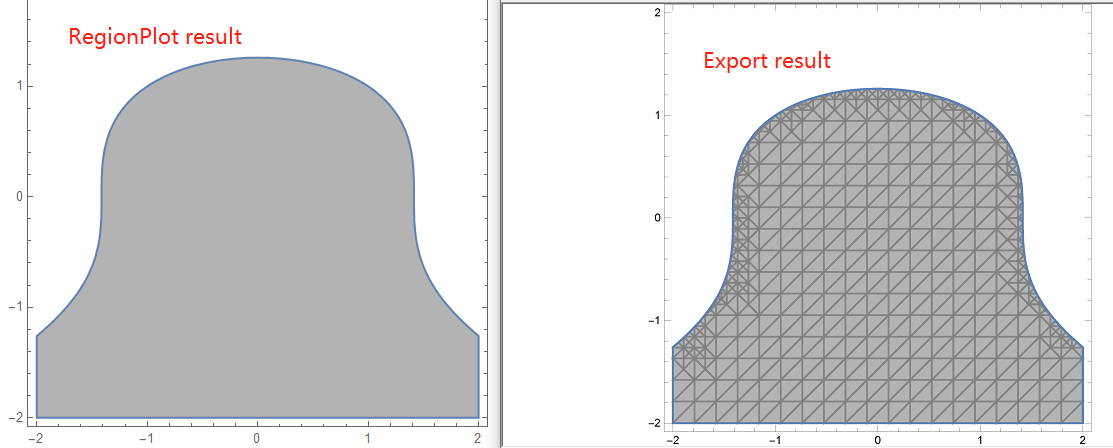
When setting the Opacity option, there are mesh grids on the background of the pdf file. Opacity option should be saved because some shapes may be overlay.

Version:12.2, Windows 10

ff = RegionPlot[x^2 + y^3 < 2, {x, -2, 2}, {y, -2, 2}, PlotStyle -> Directive[Gray, Opacity[0.6]]]
Export["ff.pdf", ff]

Mesh->none option not work. Is there any way to remove the mesh grids when exporting the image?

enter image description here

$\endgroup$
5
  • 1
    $\begingroup$ Add the setting Method -> {"TransparentPolygonMesh" -> True} to RegionPlot[] and report back. $\endgroup$ Commented Feb 9, 2021 at 7:28
  • $\begingroup$ It does not work. $\endgroup$
    – zongxian
    Commented Feb 9, 2021 at 7:32
  • $\begingroup$ Can you mention your OS and version number of Mathematica for reference? $\endgroup$ Commented Feb 9, 2021 at 12:37
  • $\begingroup$ I add the version number and OS: Version 12.2, Windows 10. $\endgroup$
    – zongxian
    Commented Feb 9, 2021 at 15:42
  • $\begingroup$ An old but highly related question: (644). $\endgroup$
    – Silvia
    Commented Feb 9, 2021 at 19:44

1 Answer 1

4
$\begingroup$

I get the same meshed result as @zongxian with and without @J.M.'s recommendation. I am using:

$Version
(* "12.2.0 for Microsoft Windows (64-bit) (December 12, 2020)" *)

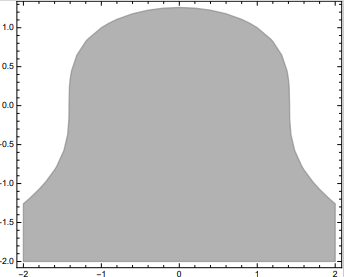
A possible workaround is to use Region with the appropriate specification like so:

ff = Region[
  Style[ImplicitRegion[x^2 + y^3 < 2, {{x, -2, 2}, {y, -2, 2}}], Gray,
    Opacity[0.6]], PlotTheme -> "Detailed"]
Export["ff.pdf", ff]

The PDF is close to what is desired as shown below:

PDF output

$\endgroup$

Your Answer

By clicking “Post Your Answer”, you agree to our terms of service and acknowledge you have read our privacy policy.

Not the answer you're looking for? Browse other questions tagged or ask your own question.