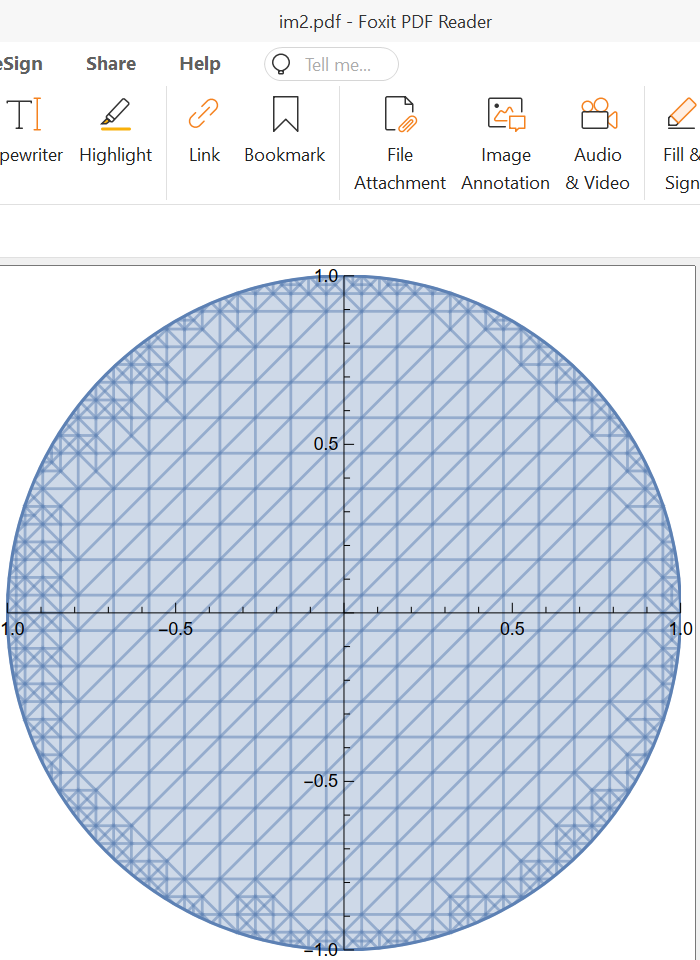
I want to plot a region using RegionPlot. The plot looks perfect when it is in mathematica. But when I export the image as .eps or .pdf file a meshgrid is appearing in the final .eps or .pdf file. Here I am attaching the code and final output. Please help me to remove the meshgrid.
Im1 = RegionPlot[x^2 + y^2 <= 1, {x, -1, 1}, {y, -1, 1},
  PlotRange -> {{-1, 1}, {-1, 1}}, Mesh -> None, MeshStyle -> None,
  Frame -> False, Axes -> True, AxesOrigin -> {0, 0},
  AspectRatio -> 1, Method -> {"TransparentPolygonMesh" -> True}]
Export["im2.pdf", Im1, "PDf"]


ff = Region[ Style[ImplicitRegion[2.5 <= y <= 2.67, {{x, 7, 14}, {y, 0, 3}}], RGBColor[0.1, 0.6, 0.3], Opacity[0.6]], PlotTheme -> "Detailed"]Doing this, you will find that, somehow the corners of the plot chopped off. $\endgroup$