0
$\begingroup$

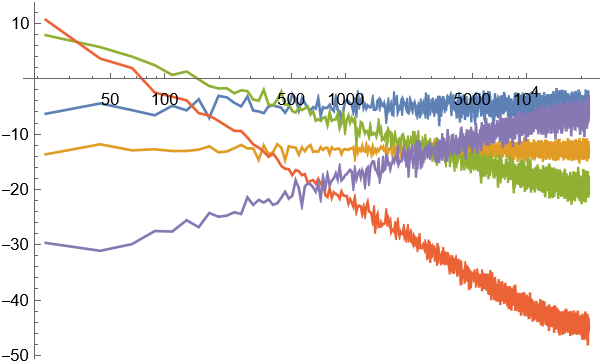
In the documentation I found a code that plots a Periodogram.

noises = {"White", "PeriodicRandomNoise", "Pink", "Brown", "Blue"};
Periodogram[AudioGenerator /@ noises, 2000, ScalingFunctions -> {"Log10", "dB"}]

How can I get a text file that will contain the time series for which the graph is plotted?

$\endgroup$

1 Answer 1

1
$\begingroup$

One way is to extract the values from the plot

pg = Periodogram[AudioGenerator /@ noises, 2000, ScalingFunctions -> {"Log10", "dB"}];
points = Cases[pg, Line[x__] -> x, ∞];

Verify

ListLinePlot[points, PlotRange -> All]

You can export each element of points to a separate file

MapThread[Export[#1 <> ".csv", #2] &, {noises, points}]
$\endgroup$

Your Answer

By clicking “Post Your Answer”, you agree to our terms of service and acknowledge you have read our privacy policy.

Not the answer you're looking for? Browse other questions tagged or ask your own question.