6
$\begingroup$

Consider some sound:

ViolinNote = Sound[SoundNote["G", 1, "Violin"]]

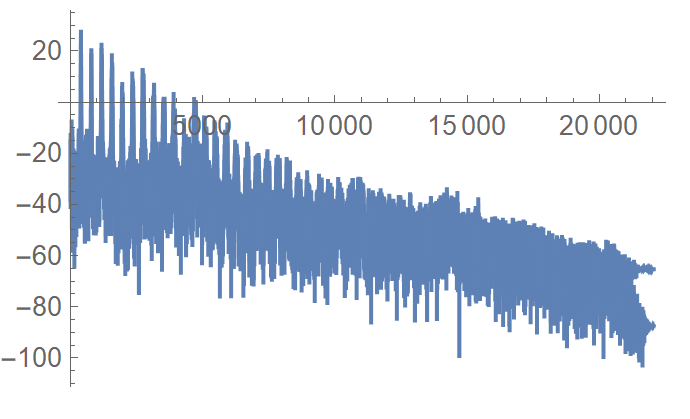
We may plot the periodogram:

Periodogram[ViolinNote]

enter image description here

The y-axis is the amplitude in dB, while the x-axis is the frequency in Hz. My question is about the meaning of 0 dB: does it mean that everything below 0 dB is not audible, and if yes then how does Mathematica extract it?

I.e., the definition the amplitude in dB, according to the reference, is

$$ \text{Amplitude (dB)} = 10\log\left( \frac{P_{2}}{P_{1}}\right) $$ where $P_{2}$ is the power (just the Fourier coefficient squared) of the given tone $\omega_{2}$. What Mathematica uses for $P_{1}$, i.e., how does Mathematica define it? I have not found the corresponding information in the documentation.

Clearly, 0 dB is not the audibility limit: one may apply the highpass filter

ViolinNoteFiltered = HighpassFilter[ViolinNote, {Quantity[5000, "Hertz"]}, 2000]

where 5000 Hz is the frequency above which the amplitude is below 0 dB, and observe that the sound is still audible.

$\endgroup$
11
  • 1
    $\begingroup$ My question is about the meaning of 0 dB: does it mean that everything below 0 dB is not audible Yes. this is from the internet The intensity of energy that these sound waves produce is measured in units called decibels (dB). The lowest hearing decibel level is 0 dB, which indicates nearly total silence and is the softest sound that the human ear can hear. Generally speaking, the louder the sound, the higher the decibel number. $\endgroup$
    – Nasser
    Commented Oct 24, 2021 at 10:56
  • 2
    $\begingroup$ But clearly here 0 db does not define the aubible sound. You may verify this by applying HighpassFilter[ViolinNote, {Quantity[5000, "Hertz"]}, 2000] and listening the resulting sound: it is audible. $\endgroup$ Commented Oct 24, 2021 at 11:03
  • $\begingroup$ animations.physics.unsw.edu.au/jw/dB.htm $\endgroup$
    – Syed
    Commented Oct 24, 2021 at 11:05
  • $\begingroup$ @Syed : what is P1 used in Mathematica? $\endgroup$ Commented Oct 24, 2021 at 11:06
  • 1
    $\begingroup$ p1 = Periodogram[ViolinNote, PlotStyle -> Red] p2 = Periodogram[AudioAmplify[ViolinNote, 1/10]] and finally Show[p1, p2]. It clearly shows that 0dB on a periodogram has a different referencing and is not related to the way the term is used in the audio business. $\endgroup$
    – Syed
    Commented Oct 24, 2021 at 11:27

1 Answer 1

7
$\begingroup$

I couldn't find anything in the documentation, but a bit of experimentation makes things clear. First, make some simple to understand test data:

dc = Table[1, {x, 1, 10000}];

Now, do a linear scale:

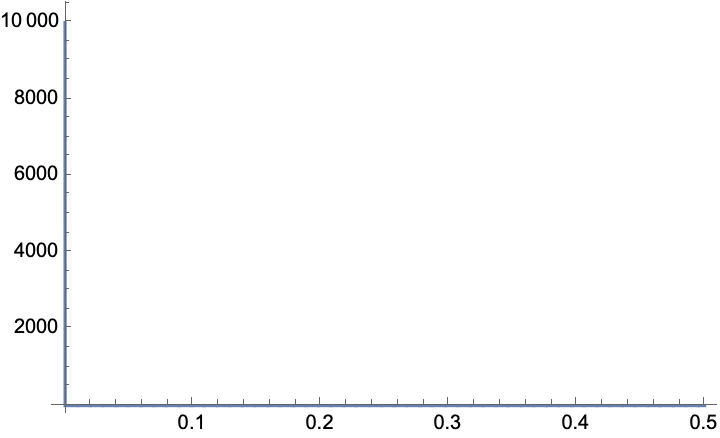
Periodogram[dc, PlotRange -> All, 
  ScalingFunctions -> {"Linear", "Absolute"}]

enter image description here

The result is peak at zero frequency, "power" 10000. Try default log scale:

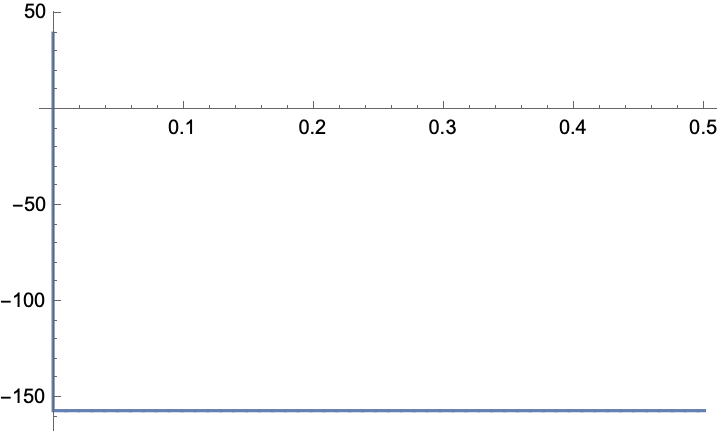
Periodogram[dc, PlotRange -> All]

enter image description hereThis yields a 40 dB peak. Sensible, given the linear result. To check, attenuate by 40 dB:

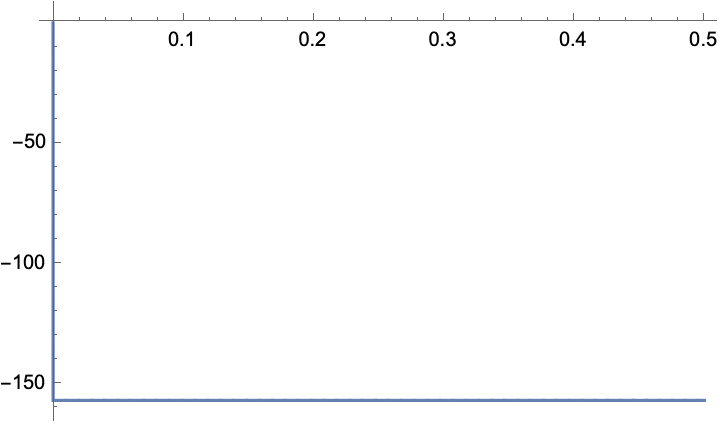
Periodogram[0.01 dc, PlotRange -> All]

enter image description hereYields a 0 dB peak. So, the dB scale is relative to a signal whose squared samples sum to one.

Total[(0.01 dc)^2]
(* 1. *)

It has nothing to do with sound pressure. Mathematica cannot guess the pressure scale of your sound samples: they are numbers in a computer, not calibrated to pressure.

$\endgroup$

Your Answer

By clicking “Post Your Answer”, you agree to our terms of service and acknowledge you have read our privacy policy.

Not the answer you're looking for? Browse other questions tagged or ask your own question.