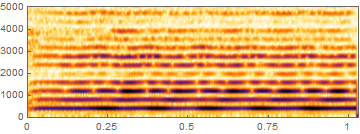
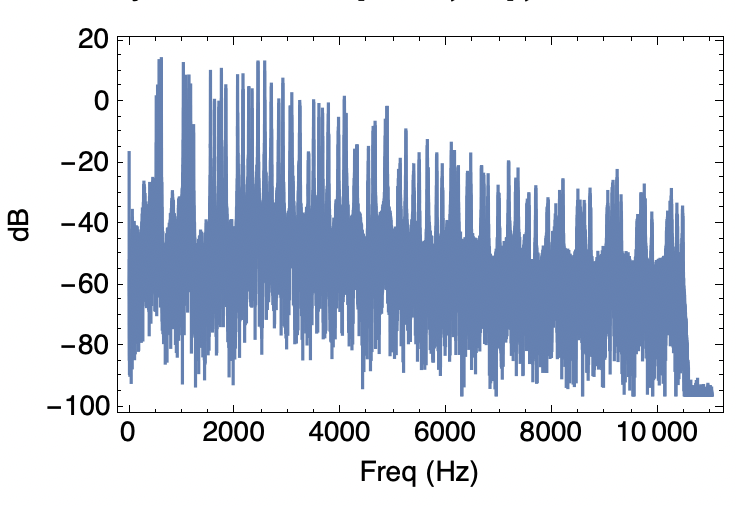
I don't really know much above Fourier Transform , or how it's used in Mathematica but I want to know how I can find out, out of which Sin-waves a (static) sound is made of.
So for example I take "G" played by a Violin
Sound[SoundNote["G", 1, "Violin"]]
Because this isn't a pure tone, I want to know, which frequencies are present in which "strength".
My Questions:
How do I get this information?
How do I plot that? (I think it's called "Frequency-Domain")
How do I plot all the involved frequencies together?
I know, this may be simple for some people, but I have neither much know-how in Mathematica, nor do I know how to use Fourier Transform at all.
Hope you can help me, nxt191 aka Marc


