1
$\begingroup$

I wanted to plot the function $$f(x) = \frac{x^2}{2} - 3\ln(\vert x\vert +2)$$

together with its derivative $$f'(x) = x - \frac{3x}{\vert x \vert(\vert x\vert +2)}$$

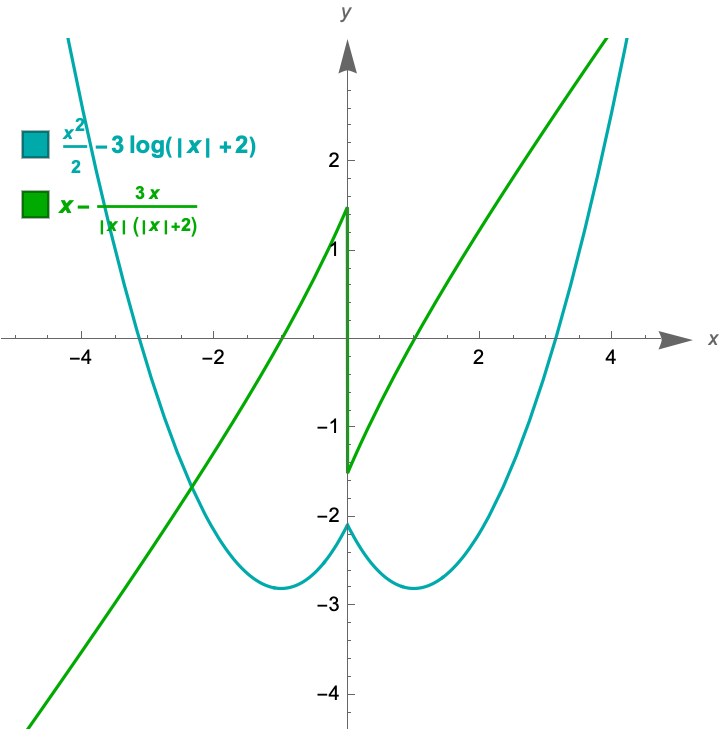
which exhibites a cusp point at $x = 0$. Here is what I produced:

Clear[f, g, plot, reg];
f[x_] = x^2/2 - 3 Log[2 + Abs[x]];
g[x_] = x - (3 x)/(Abs[x] (2 + Abs[x]));
plot = Plot[{f[x], g[x]}, {x, -5, 5}, 
   PlotStyle -> {Darker@Cyan, Darker@Green}, AspectRatio -> 1, 
   PlotLegends -> 
    Placed[
     SwatchLegend[{Darker[Cyan], 
       Darker[Green]}, {Style[x^2/2 - 3 Log[2 + Abs[x]], Darker[Cyan],
         Bold], 
       Style[
        Style[x - (3 x)/(Abs[x] (2 + Abs[x])), Darker[Green], Bold]]},
       LegendMarkerSize -> {15, 15}], {0.2, 0.8}], 
   AxesLabel -> {x, y}];
Show[plot, PlotRange -> {-4, 3}, AxesStyle -> Arrowheads[{0.05}], 
 Axes -> True, Frame -> False, 
 GridLines -> {{{{Thick, AbsoluteDashing[{3, 3}]}}}, None}]

The output image is this:

enter image description here

(Forget about the legend, which I can move or shrink, not a problem now).

I would like to know how to improve that code in order to basically get the followings:

  • First of all the derivative (green): why is there that vertical line on the $Y$ axis? Also, why the limits seem to approach $\pm 3/2$ instead of $\pm \infty$?

  • How to get bold, or thicker, axes? I tried with the bold command for the axes but it seems to not work. Does it collide with other code by chance?

  • Is there a way to produce the functions so that they are dotted at their ends?

  • Since we are here, I take the chance to ask for general improvements, from some experts like you!

Thank you!

$\endgroup$

2 Answers 2

2
$\begingroup$
$Version

(* "13.2.0 for Mac OS X x86 (64-bit) (November 18, 2022)" *)

Clear["Global`*"]

f[x_] = x^2/2 - 3 Log[2 + RealAbs[x]]; (* RealAbs can be 
   differentiated *)

Plot[Evaluate[
  Join[
   ConditionalExpression[#, Abs[x] < 4.5] & /@ {f[x], f'[x]},
   ConditionalExpression[#, Abs[x] > 4.5] & /@ {f[x], f'[x]}]],
 {x, -5, 5},
 Exclusions -> All (* not needed with my version *),
 GridLines -> {Automatic, None},
 GridLinesStyle -> Directive[Thin, AbsoluteDashing[{3, 3}]],
 PlotStyle -> {Darker[Cyan, 0.1], Darker[Green, 0.2],
   {Darker[Cyan, 0.1], Dashed}, {Darker[Green, 0.2], Dashed}},
 PlotLegends -> Placed[
   SwatchLegend[
    (StringForm["`` = ``", #, ReleaseHold@#] & /@
      {HoldForm[f[x]], HoldForm[f'[x]]}),
    LegendMarkerSize -> 15],
   {.275, .85}],
 ImageSize -> 450]

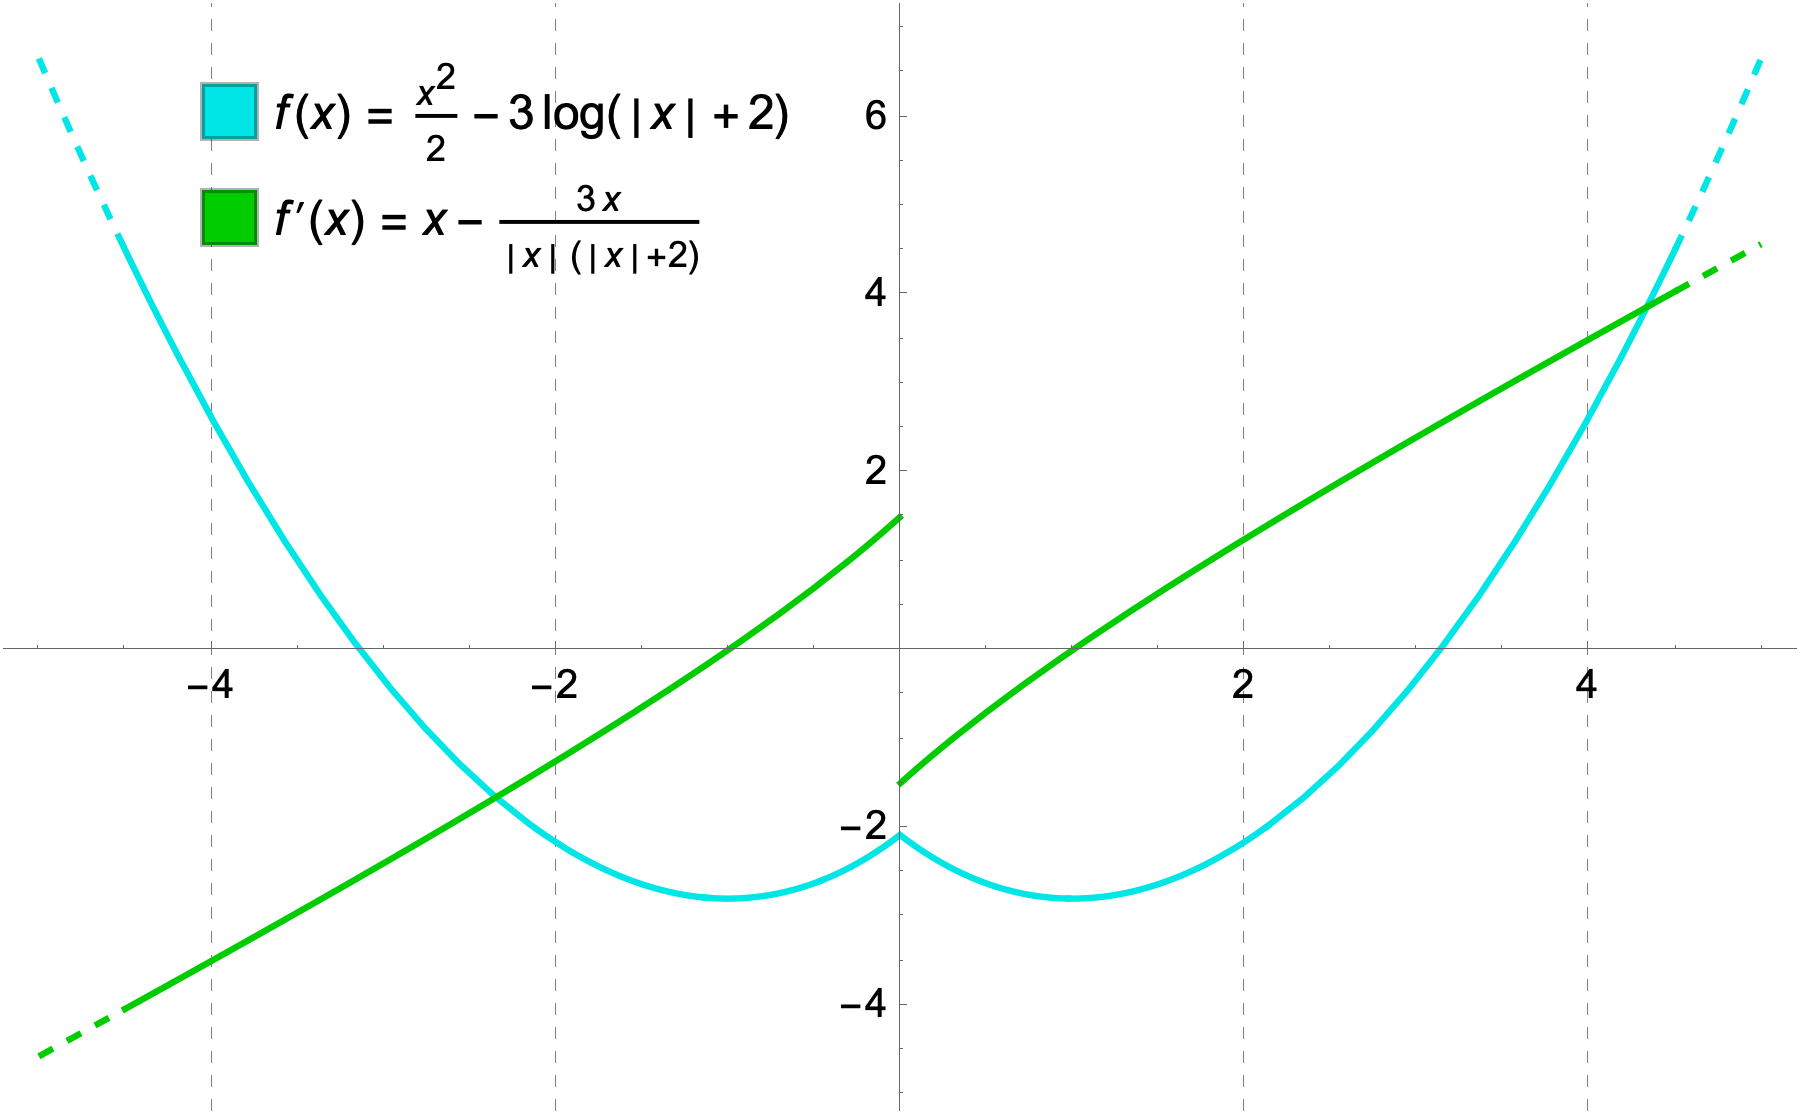
enter image description here

$\endgroup$
1
  • $\begingroup$ o.O Wow. Stunning! $\endgroup$
    – Enrico M.
    Commented Jan 24, 2023 at 19:00
3
$\begingroup$

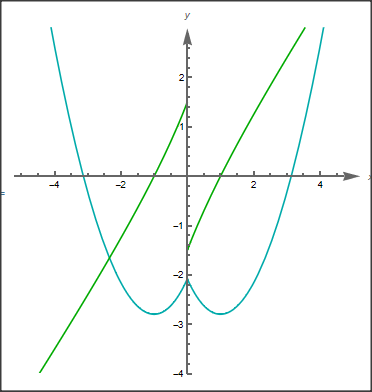
First, the limit of the derivative at zero is +/- 3/2 not infinity.

For simplicity, I eliminated the legend.

You must define the x and y axis separately.

I do not understand what you mean by: "dotted at the end"

Plot[{f[x], g[x]}, {x, -5, 5}, 
 PlotStyle -> {Darker@Cyan, Darker@Green}, AspectRatio -> 1, 
 AxesLabel -> {x, y}, PlotRange -> {-4, 3}, 
 AxesStyle -> {{Thick, Arrowheads[{0.05}]}, {Thick, 
    Arrowheads[{0.05}]}}]

enter image description here

$\endgroup$
2
  • $\begingroup$ By dotted at the end I mean a way to show the curves "go on" $\endgroup$
    – Enrico M.
    Commented Jan 24, 2023 at 18:29
  • $\begingroup$ Oh, Solved! I calculated the limit in a wrong way. I really have to sleep. I had to use log properties in order to turn that limit into an Eulerian limit haha. Forget the first question! $\endgroup$
    – Enrico M.
    Commented Jan 24, 2023 at 18:37

Your Answer

By clicking “Post Your Answer”, you agree to our terms of service and acknowledge you have read our privacy policy.

Not the answer you're looking for? Browse other questions tagged or ask your own question.