I wanted to plot the function $$f(x) = \frac{x^2}{2} - 3\ln(\vert x\vert +2)$$
together with its derivative $$f'(x) = x - \frac{3x}{\vert x \vert(\vert x\vert +2)}$$
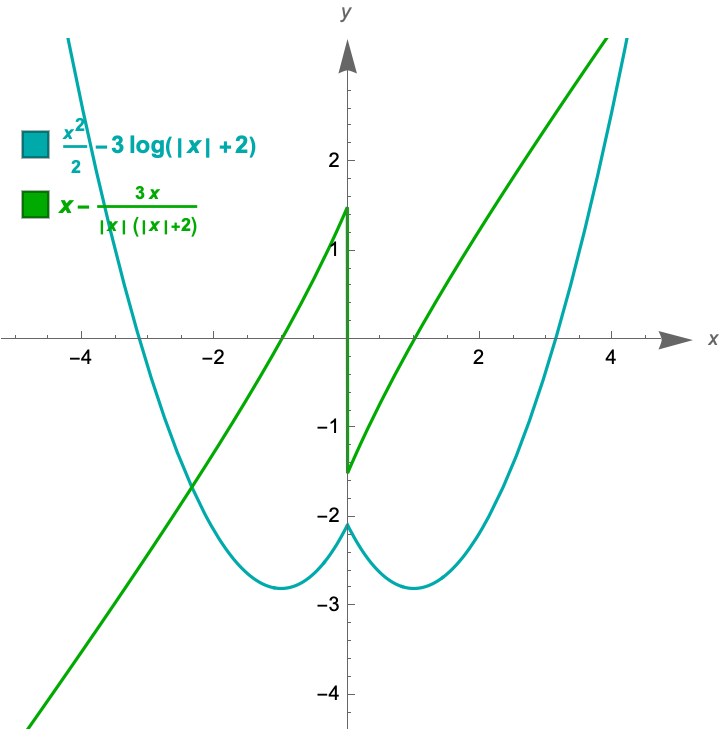
which exhibites a cusp point at $x = 0$. Here is what I produced:
Clear[f, g, plot, reg];
f[x_] = x^2/2 - 3 Log[2 + Abs[x]];
g[x_] = x - (3 x)/(Abs[x] (2 + Abs[x]));
plot = Plot[{f[x], g[x]}, {x, -5, 5},
   PlotStyle -> {Darker@Cyan, Darker@Green}, AspectRatio -> 1,
   PlotLegends ->
    Placed[
     SwatchLegend[{Darker[Cyan],
       Darker[Green]}, {Style[x^2/2 - 3 Log[2 + Abs[x]], Darker[Cyan],
         Bold],
       Style[
        Style[x - (3 x)/(Abs[x] (2 + Abs[x])), Darker[Green], Bold]]},
       LegendMarkerSize -> {15, 15}], {0.2, 0.8}],
   AxesLabel -> {x, y}];
Show[plot, PlotRange -> {-4, 3}, AxesStyle -> Arrowheads[{0.05}],
 Axes -> True, Frame -> False,
 GridLines -> {{{{Thick, AbsoluteDashing[{3, 3}]}}}, None}]
The output image is this:
(Forget about the legend, which I can move or shrink, not a problem now).
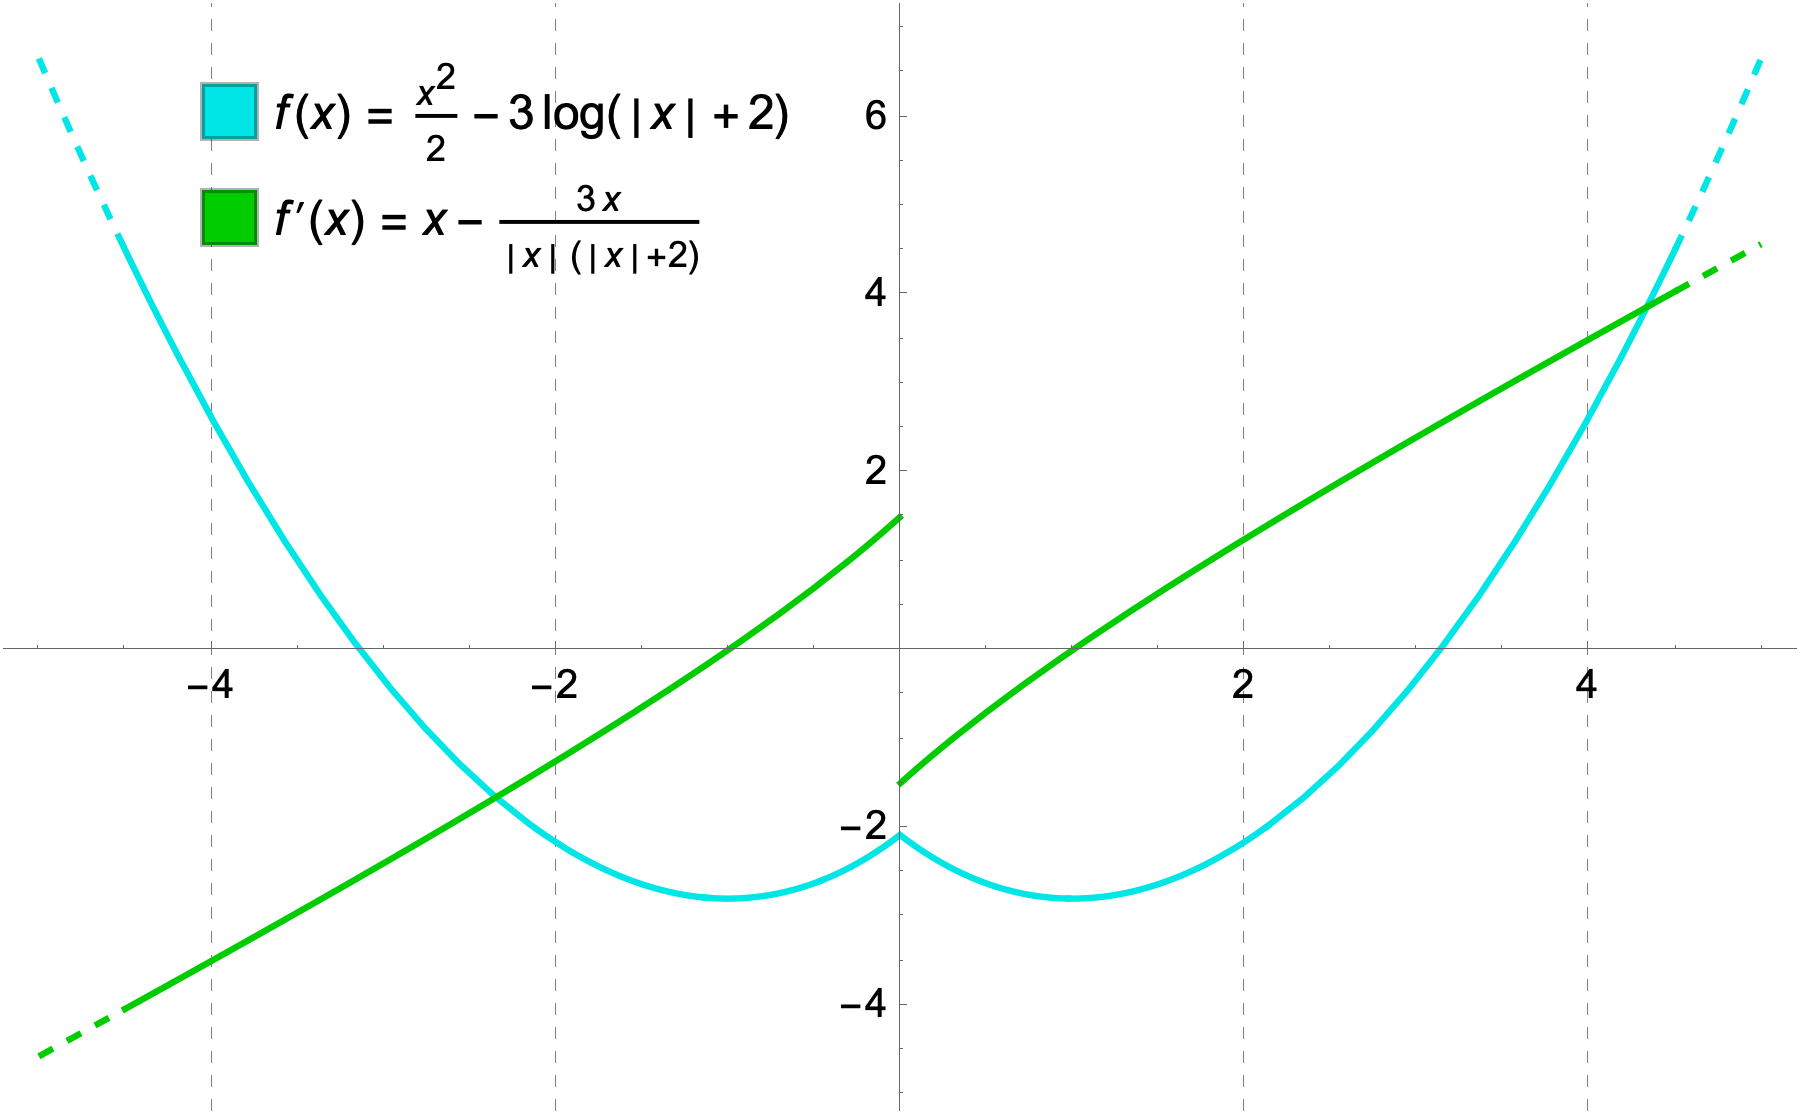
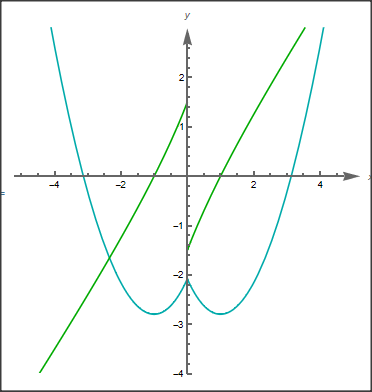
I would like to know how to improve that code in order to basically get the followings:
First of all the derivative (green): why is there that vertical line on the $Y$ axis? Also, why the limits seem to approach $\pm 3/2$ instead of $\pm \infty$?
How to get bold, or thicker, axes? I tried with the bold command for the axes but it seems to not work. Does it collide with other code by chance?
Is there a way to produce the functions so that they are dotted at their ends?
Since we are here, I take the chance to ask for general improvements, from some experts like you!
Thank you!


