2
$\begingroup$

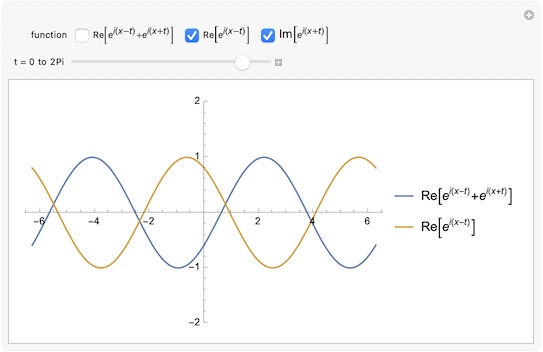
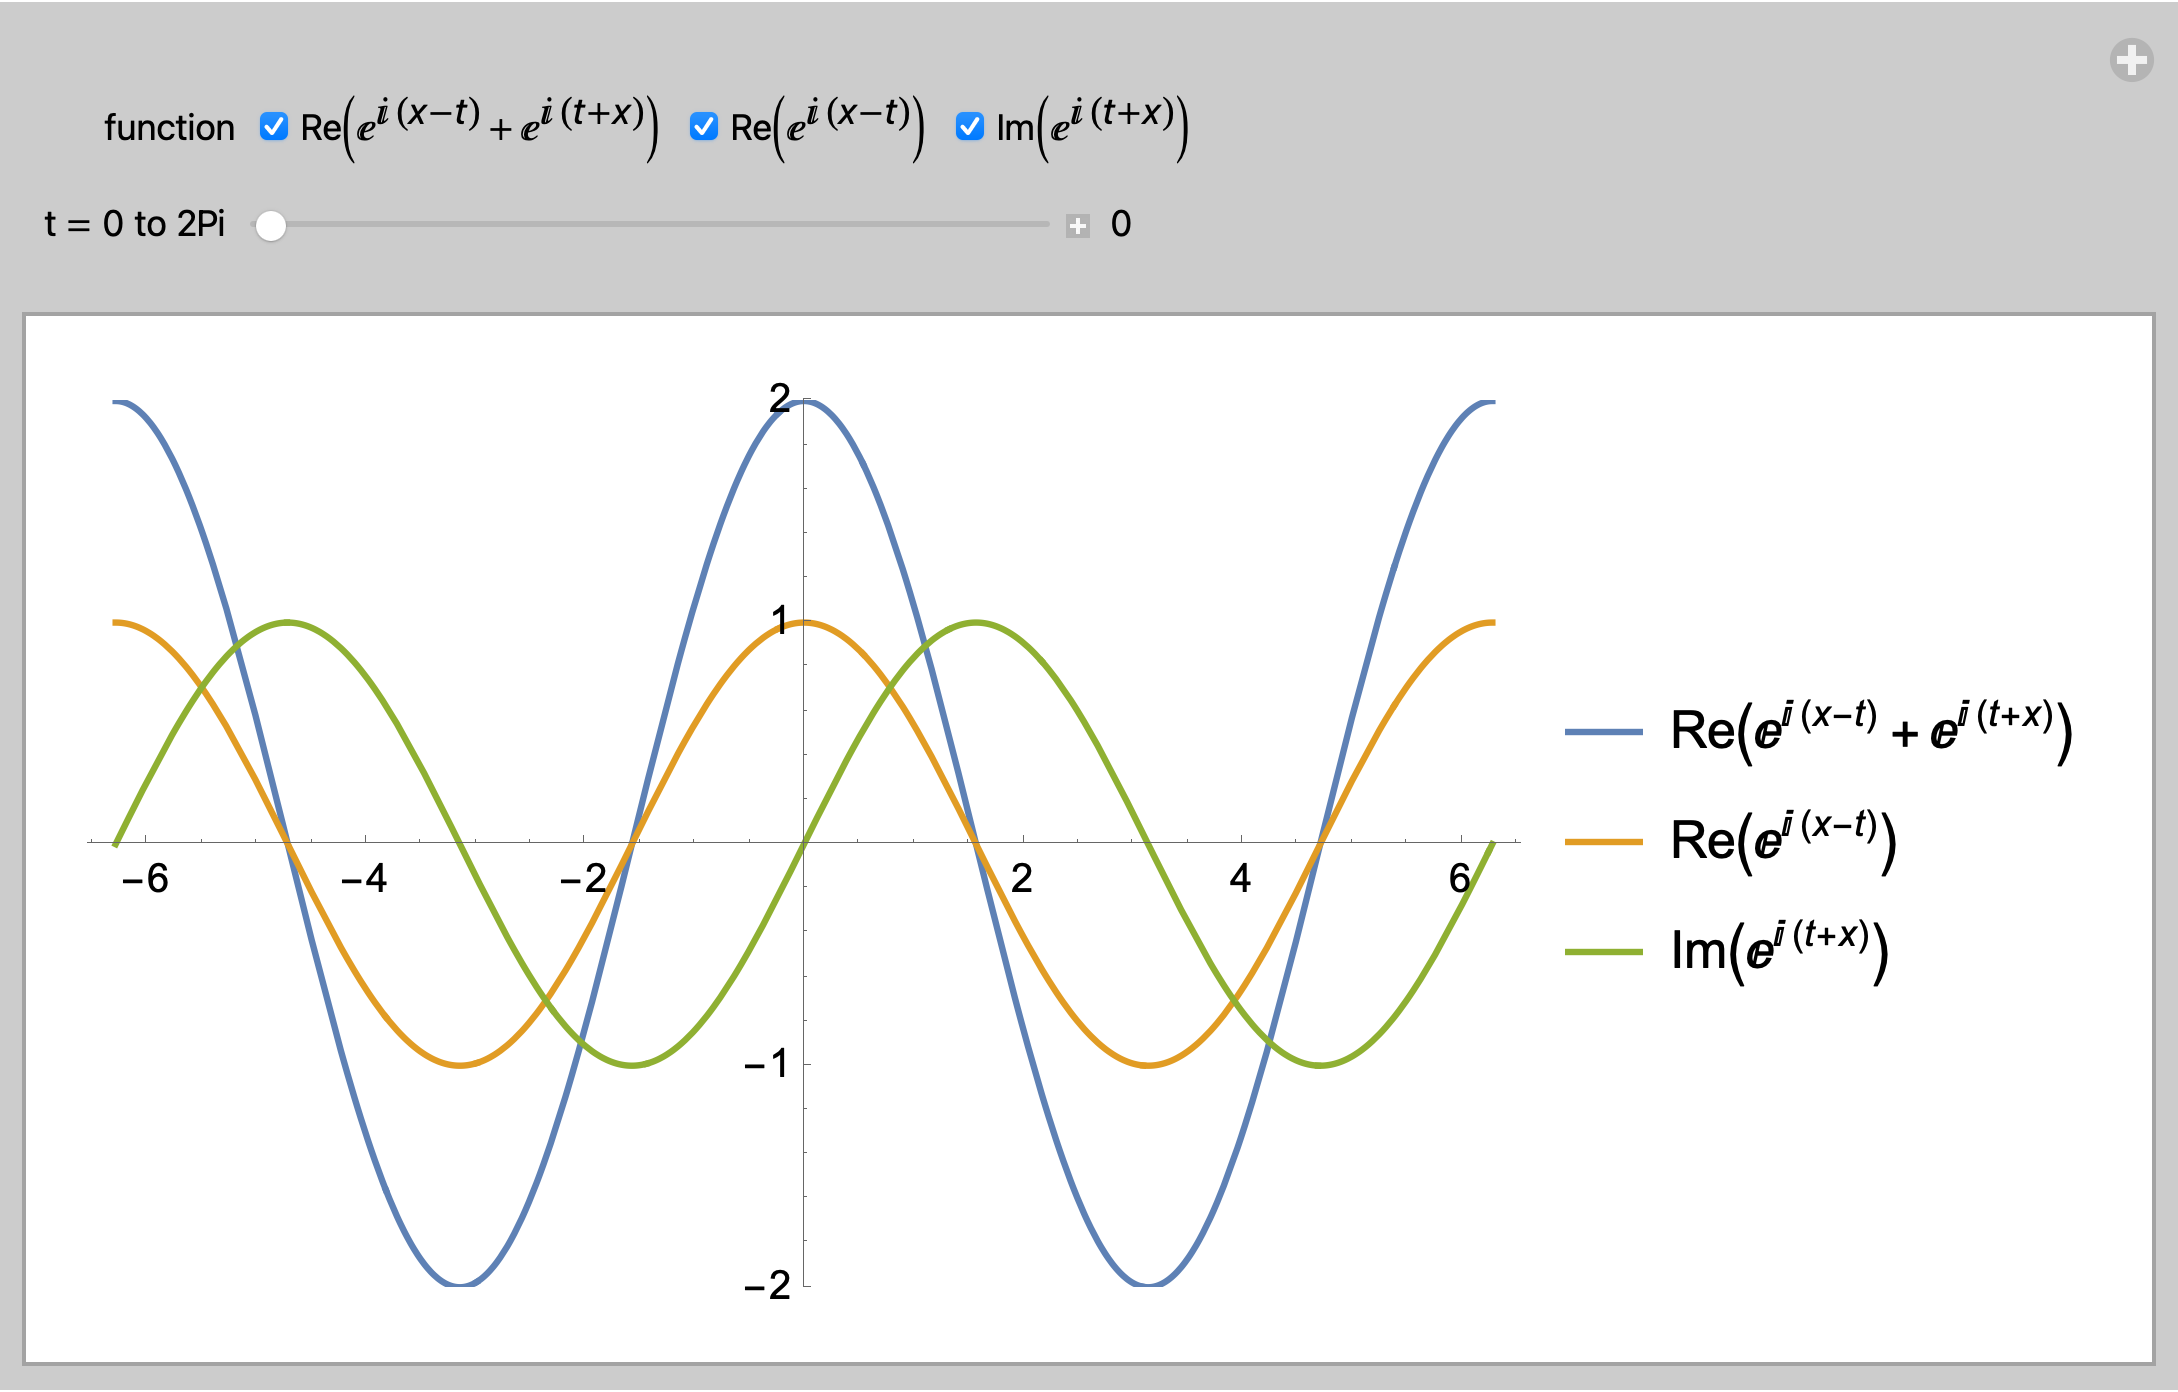
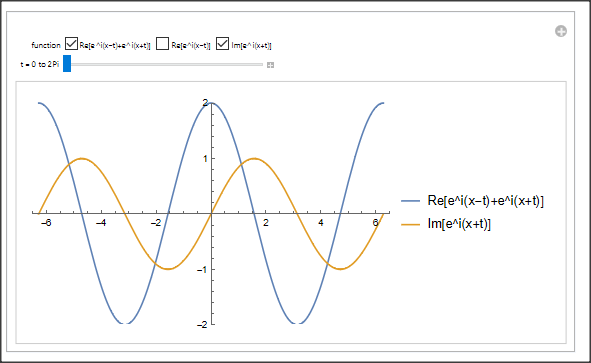
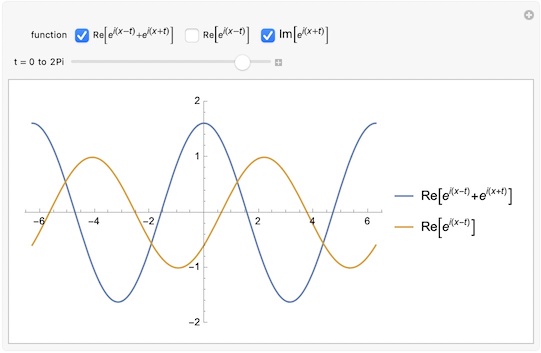
In using Manipulate to illustrate selectively function dynamics I encountered the following difficulty with the PlotLegends option. There are three plots, which can be selected through the 'function' variable check boxes. They display separately or in combination. The PlotLegends option, however, only displays the legend labels in order, starting from the first one, regardless of which 'function' boxes are selected.

Manipulate[Plot[Evaluate[function /. t -> tt], {x, -2 Pi, 2 Pi}, PlotRange -> {-2, 2}, 
PlotLegends -> {"Re[e^i(x-t)+e^i(x+t)]", "Re[e^i(x-t)]", "Im[e^i(x+t)]"}], 
{{function, {Re[Exp[I (x - t)] + Exp[I (x + t)]]}}, 
{Re[Exp[I (x - t)] + Exp[I (x + t)]] -> "Re[e^i(x-t)+e^i(x+t)]", 
Re[Exp[I (x - t)]] -> "Re[e^i(x-t)]", Im[Exp[I (x + t)]] -> "Im[e^i(x+t)]"}, 
CheckboxBar}, {{tt, 0, "t = 0 to 2Pi "}, 0, 2 Pi}]

Two illustrating images, showing mismatched function selection and plot legends, are included below.

![Mismatch 1

![Mismatch 1

I shall be grateful for any suggestions how to set the plot legends, so that they always correspond correctly to any combination of the function plot selections. (There could be a trivial answer, but I have not succeeded in finding it.)

$\endgroup$
2
  • $\begingroup$ try using PlotLegends -> function? $\endgroup$
    – kglr
    Commented Jan 24, 2023 at 11:55
  • 1
    $\begingroup$ Thank you kglr. I would not have worked out how exactly, but Daniel's answer was clear and helpful. Now I understand what you meant. $\endgroup$
    – ghogoh
    Commented Jan 24, 2023 at 16:03

2 Answers 2

3
$\begingroup$
Clear["Global`*"]

The order of the functions in the legend should remain constant as the selections change. Likewise, the color associated with each function should remain constant. To accomplish this, the CheckboxBar values should be indices.

funcs = {
   Re[Exp[I (x - t)] + Exp[I (x + t)]],
   Re[Exp[I (x - t)]],
   Im[Exp[I (x + t)]]};

colors = ColorData[97] /@ Range[Length[funcs]];

Manipulate[
 function = Sort@function (* keeps legends in consistent order *);
 Plot[
  Evaluate[funcs[[function]] /. t -> tt],
  {x, -2 Pi, 2 Pi},
  PlotStyle -> colors[[function]] (* keeps colors consistent *),
  PlotRange -> {-2, 2},
  PlotLegends -> {funcs[[function]]}],
 {{function, {1, 2, 3}},
  Thread[Range[Length[funcs]] -> (TraditionalForm /@ funcs)],
  CheckboxBar},
 {{tt, 0, "t = 0 to 2Pi "}, 0, 2 Pi, Appearance -> "Labeled"}]

enter image description here

$\endgroup$
1
  • $\begingroup$ Most impressive! My appreciation is much more than the +1 I am limited to. Thank you, Bob. $\endgroup$
    – ghogoh
    Commented Jan 25, 2023 at 8:41
3
$\begingroup$

You must specify as many labels as there are functions to plot:

Manipulate[
 Plot[Evaluate[function /. t -> tt], {x, -2 Pi, 2 Pi}, 
  PlotRange -> {-2, 2},
  PlotLegends -> 
   Evaluate[
    function /. {Re[Exp[I (x - t)] + Exp[I (x + t)]] -> 
       "Re[e^i(x-t)+e^i(x+t)]", Re[Exp[I (x - t)]] -> "Re[e^i(x-t)]", 
      Im[Exp[I (x + t)]] -> "Im[e^i(x+t)]"}]]
 , {{function, {Re[Exp[I (x - t)] + Exp[I (x + t)]]}}, {Re[
     Exp[I (x - t)] + Exp[I (x + t)]] -> "Re[e^i(x-t)+e^i(x+t)]", 
   Re[Exp[I (x - t)]] -> "Re[e^i(x-t)]", 
   Im[Exp[I (x + t)]] -> "Im[e^i(x+t)]"}, 
  CheckboxBar}, {{tt, 0, "t = 0 to 2Pi "}, 0, 2 Pi}]

enter+image+description+here

$\endgroup$
1
  • $\begingroup$ Thank you very much, Daniel. I was not aware that PlotLegends can take such definitions. Works exactly as needed. Most helpful! $\endgroup$
    – ghogoh
    Commented Jan 24, 2023 at 16:01

Your Answer

By clicking “Post Your Answer”, you agree to our terms of service and acknowledge you have read our privacy policy.

Not the answer you're looking for? Browse other questions tagged or ask your own question.