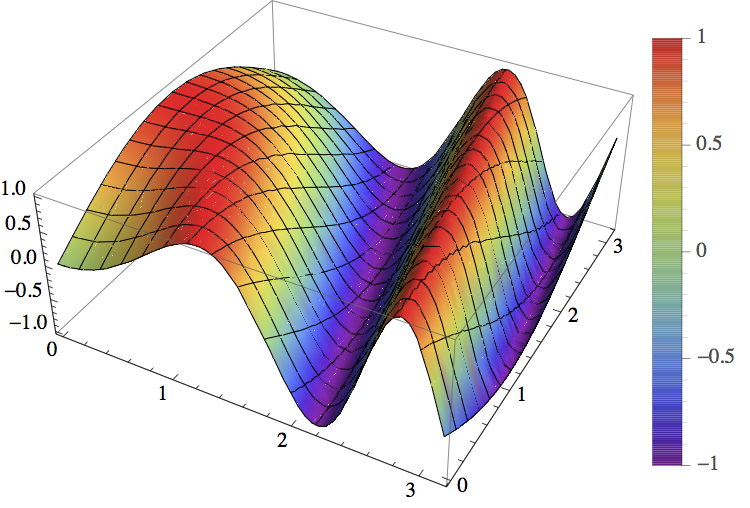
I'm sensing this might be a rookie mistake but normally I roll my own legends but decided to try the built in legends for a ListPlot3D. PlotLegends is listed as an option for ListPlot3D but curiously in V9 there are no usage examples. On the other hand there are several examples for Plot3D. Specifically I was trying to create a legend analogous to this example from the Plot3D docs.
ListPlot3D[Table[Sin[x y], {y, 0, 3, 0.1}, {x, 0, 3, 0.1}],
 ColorFunction -> "Rainbow", PlotLegends -> Automatic]

However I want to use my own specific ColorFunction but it appears that as soon as you depart from the named built-in string colour functions PlotLegends ceases to work.
I know how to "roll my own" so I am not seeking assistance with creating my own function. I simply want to know if it is possible to make something similar using the built in options for ListPlot3D, whether I am overlooking something or whether this is a bug.
Edit
From Wolfram: the current design of the PlotLegends -> Automatic option is to turn off the plot legend when a pure function (as ColorFunction) is present.
which means that this
With[{cf = Blend[{Blue, White, Red}, #] &,
data = Table[Sin[x y], {y, 0, 3, 0.1}, {x, 0, 3, 0.1}]},
    ListPlot3D[data, ColorFunction -> cf,
        PlotLegends -> Automatic
    ]
]
doesn't work ...which would appear to make it a design oversight rather than a bug.


Automaticdoesn't work for a valid userColorFunction$\endgroup$