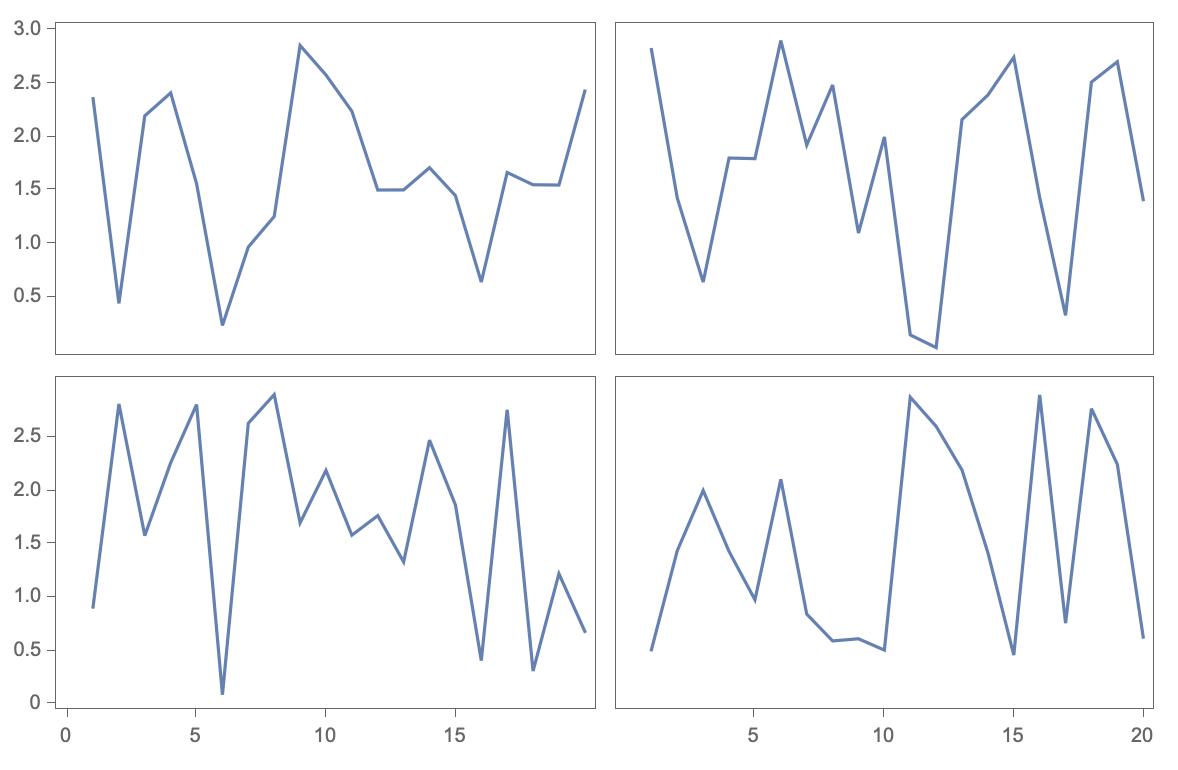
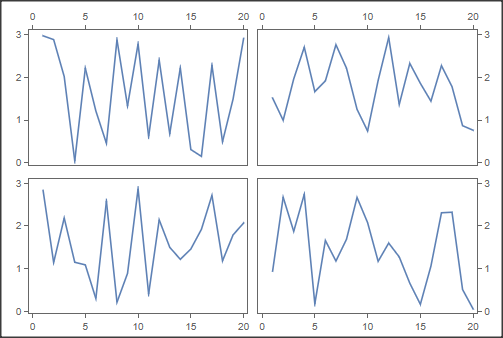
When you display a grid of graphs in the same Plot using PlotLayout, for example through
ListLinePlot[
 RandomReal[3, {4, 20}],
 PlotLayout -> {"Row", 2},
 Method -> {"Spacings" -> {10, 10}}
 ]
(Example code stolen from an answer to this question),
then Mathematica will cut off etc the bottom tick from the upper graphs and the top tick from the lower graphs like so
 Note the absence of the
 0 tick from the top axis and the 3.0 tick from the bottom as well as the 20 tick from the LHS axis and the 0 tick from the RHS one. This is clearly a sensible default behaviour because usually they would overlap and so it is clearer to show neither. In my case though would prefer to appropriately space the graphs so both ticks can be displayed.
This is still the behaviour if I manually specify the ticks through the Ticks option.
Is there a way to have Mathematica display all the ticks while still displaying my grid through the PlotLayout option, i.e. not by instead using GraphicsGrid?

