0
$\begingroup$

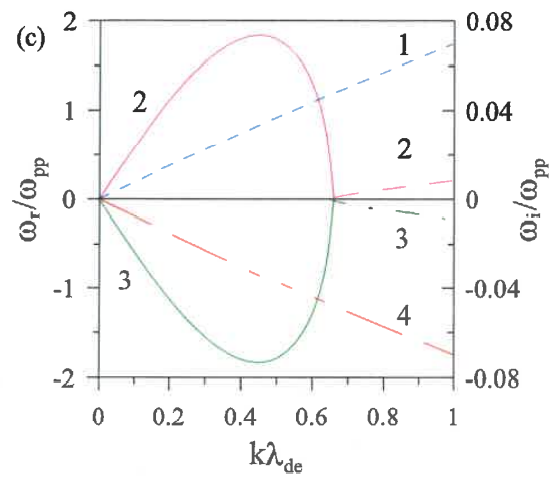
I am new to Mathematica and trying to reproduce the following figure using ContourPlot:

enter image description here

(From: https://iopscience.iop.org/article/10.1088/1402-4896/abb2e0/meta)

My code:

n1 = 0.5
n2 = 0.5
sig1 = 0.1
sig2 = 0.1
U1 = -1
U2 = 1

ContourPlot[n1/((Omg - K*U1)^2 - 3*K^2*sig1) + n2/((Omg - K*U2)^2 - 3*K^2*sig2) - 1/K^2 == 1, 
           {K, 0, 1}, {Omg, -2, 2}, Axes -> True, Exclusions -> 
           {(Omg - K*U1)^2 - 3*K^2*sig1 ==  0, (Omg - K*U2)^2 - 3*K^2*sig2 == 0}]

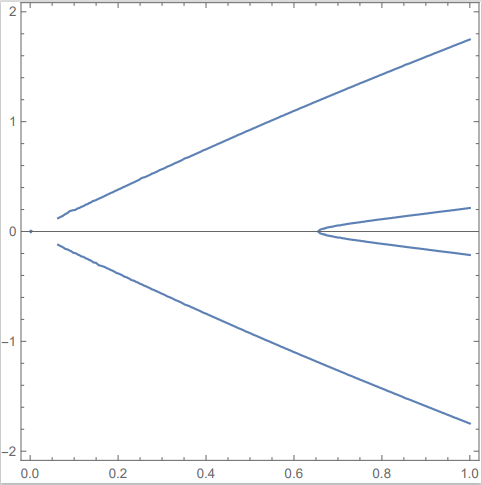
The output:

enter image description here

As seen in the output plot, ContourPlot only returns and plots the real solutions.

Is there another Mathematica function that plots both the complex and real solutions with different line styles, and a double axis as shown in the first figure?

I am using Mathematica 10. I tried to use ReImPlot but no luck.

The code for 'ReImPlot':

ReImPlot[n1/((Omg - K*U1)^2 - 3*K^2*sig1) + n2/((Omg - K*U2)^2 - 3*K^2*sig2) - 1/K^2 == 1, {K, 0, 1}, {Omg, -2, 2}, Axes -> True, Exclusions -> 
   {(Omg - K*U1)^2 - 3*K^2*sig1 ==  0, (Omg - K*U2)^2 - 3*K^2*sig2 == 0}]

The output:
enter image description here

$\endgroup$
0

1 Answer 1

1
$\begingroup$

Let me show you part of the job.

Using leftsided equation==0 and splitting Omg into real and imaginary part. {Omg -> o1 + I o2} Then taking real an imaginary part of equation and eliminating o2 for real plot and o1 for imaginary plot.

n1 = 1/2;
n2 = 1/2;
sig1 = 1/10;
sig2 = 1/10;
U1 = -1
U2 = 1

feq = Subtract @@ (n1/((Omg - K*U1)^2 - 3*K^2*sig1) + 
      n2/((Omg - K*U2)^2 - 3*K^2*sig2) - 1/K^2 == 1);

ceRe = ComplexExpand[
  Re[feq /. {Omg -> o1 + I o2} // Together // Numerator], 
  TargetFunctions -> {Re, Im}]

ceIm = ComplexExpand[
  Im[feq /. {Omg -> o1 + I o2} // Together // Numerator], 
  TargetFunctions -> {Re, Im}]

(tho1 = Thread[
    o1 == (o1 /. 
        Solve[{ceRe == 0, ceIm == 0, 0 < K < 1, -2 < o1 < 2}, 
         o1, {o2}, Reals] // FullSimplify)]) // TableForm


tho2 = Thread[
  o2 == (o2 /. 
      Solve[{ceRe == 0, ceIm == 0, 0 < K < 1, -1/10 < o2 < 1/10}, 
       o2, {o1}, Reals] // FullSimplify)]

{cp1 = ContourPlot[Evaluate[tho1[[All, 1]]], {K, 0, 1}, {o1, -2, 2}, 
   PlotPoints -> 80, Exclusions -> Sqrt[3/7] == K], 
 cp2 = ContourPlot[
   Evaluate[tho2[[All, 1]]], {K, 0, 1}, {o2, -8/100, 8/100}, 
   PlotPoints -> 30, Exclusions -> Sqrt[3/7] == K]}

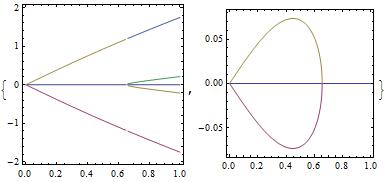
enter image description here

Leave it to you to combine both plots the way you like.

Get explicit solutions with Solve

sol = Solve[{ceRe == 0, ceIm == 0, 0 < K < 1}, {o1, o2}, Reals] // 
   FullSimplify

{Plot[Evaluate[o1 /. sol], {K, 0, 1}], 
 Plot[Evaluate[o2 /. sol], {K, 0, 1}]}

enter image description here

$\endgroup$
2
  • $\begingroup$ Thank you for a well-presented answer. If I may ask, how did calculate the K = sqrt(3/7) part? $\endgroup$
    – user87350
    Commented Jul 11, 2022 at 19:02
  • $\begingroup$ Solve gives you ConditionalExpression[ o1 ==....., 0 < K < Sqrt[3/7] || Sqrt[3/7] < K < 1] . Says K==Sqrt]3/7] is excluded. $\endgroup$
    – Akku14
    Commented Jul 11, 2022 at 20:40

Your Answer

By clicking “Post Your Answer”, you agree to our terms of service and acknowledge you have read our privacy policy.