0
$\begingroup$
Block[{const = {2.2, 3.1, 3.5}}, 
 plt0 = ListLinePlot[
   Table[{x, Sin[x #]}, {x, 0, 10, 0.05}] & /@ {1, 2, 3}, 
   PlotRange -> {{0, 10}, {-1, 1}}, FrameLabel -> {"X ", "Y"}, 
   PlotRangeClipping -> False, Frame -> True, ImagePadding -> 50, 
   PlotLegends -> 
    Placed[LineLegend[{ToString[#] & /@ const}, 
      LegendLayout -> {"Row", 1}, 
      LegendMarkerSize -> 8], {{0.5, 0.5}, {0.5, -3}}]]] 

enter image description here

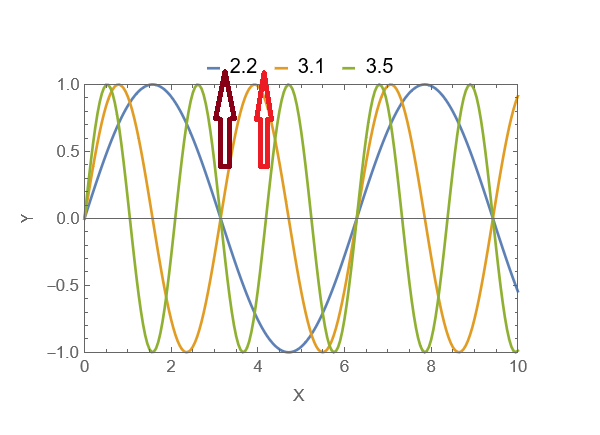
Is it possible to control the space indicated by the red arrows and make it smaller?

$\endgroup$
4
  • $\begingroup$ It would be good to provide a minimal example. This is a question about LineLegend I think, so why not make a very simple plot with only the option that causes problems? Also, you use MaTeX which is not available by default in Mathematica. $\endgroup$
    – user293787
    Commented Jul 7, 2022 at 8:25
  • $\begingroup$ thanks for the comment, I updated the question $\endgroup$
    – MMA13
    Commented Jul 7, 2022 at 8:41
  • 1
    $\begingroup$ add the option Spacings -> {.5,.3} (replace {.5, 3} with your choice) in LineLegend? $\endgroup$
    – kglr
    Commented Jul 7, 2022 at 12:14
  • $\begingroup$ @kglr that is exactly what looking for..Thanks a lot! $\endgroup$
    – MMA13
    Commented Jul 7, 2022 at 13:15

2 Answers 2

1
$\begingroup$

Based on this answer you could try to replace

ToString[#] &

by something like

Framed[ToString[#],
       FrameStyle->None,
       FrameMargins->{{-5,-5},{0,0}},
       ContentPadding->False] &
$\endgroup$
1
$\begingroup$

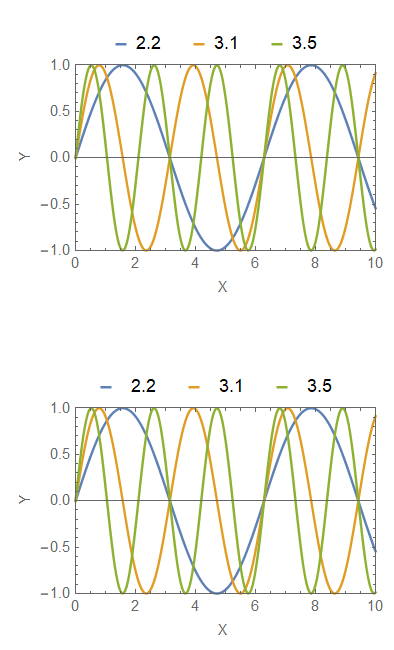
The distance between the line and the figure one can control by placing the empty space after the quote: "2.2", " 2.2" or " 2.2". The space between two different legends one can also enter as white space, or alternatively by using Spacer. As an example, I give below two images with different spacings:

Column[{
  Block[{const = {2.2, 3.1, 3.5}}, 
   plt0 = ListLinePlot[
     Table[{x, Sin[x #]}, {x, 0, 10, 0.05}] & /@ {1, 2, 3}, 
     PlotRange -> {{0, 10}, {-1, 1}}, FrameLabel -> {"X ", "Y"}, 
     PlotRangeClipping -> False, Frame -> True, ImagePadding -> 50, 
     PlotLegends -> 
      Placed[LineLegend[{"2.2" Spacer[10], "3.1" Spacer[10], 
         "3.5" Spacer[10]}, LegendLayout -> {"Row", 1}, 
        LegendMarkerSize -> 8], Scaled[{0.5, 1.01}]], 
     ImageSize -> 300]],


  Block[{const = {2.2, 3.1, 3.5}}, 
   plt0 = ListLinePlot[
     Table[{x, Sin[x #]}, {x, 0, 10, 0.05}] & /@ {1, 2, 3}, 
     PlotRange -> {{0, 10}, {-1, 1}}, FrameLabel -> {"X ", "Y"}, 
     PlotRangeClipping -> False, Frame -> True, ImagePadding -> 50, 
     PlotLegends -> 
      Placed[LineLegend[{"  2.2" Spacer[10], "  3.1" Spacer[10], 
         "  3.5" Spacer[10]}, LegendLayout -> {"Row", 1}, 
        LegendMarkerSize -> 8], Scaled[{0.5, 1.01}]], 
     ImageSize -> 300]]
  }]

returning the following:
enter image description here

$\endgroup$

Your Answer

By clicking “Post Your Answer”, you agree to our terms of service and acknowledge you have read our privacy policy.

Not the answer you're looking for? Browse other questions tagged or ask your own question.