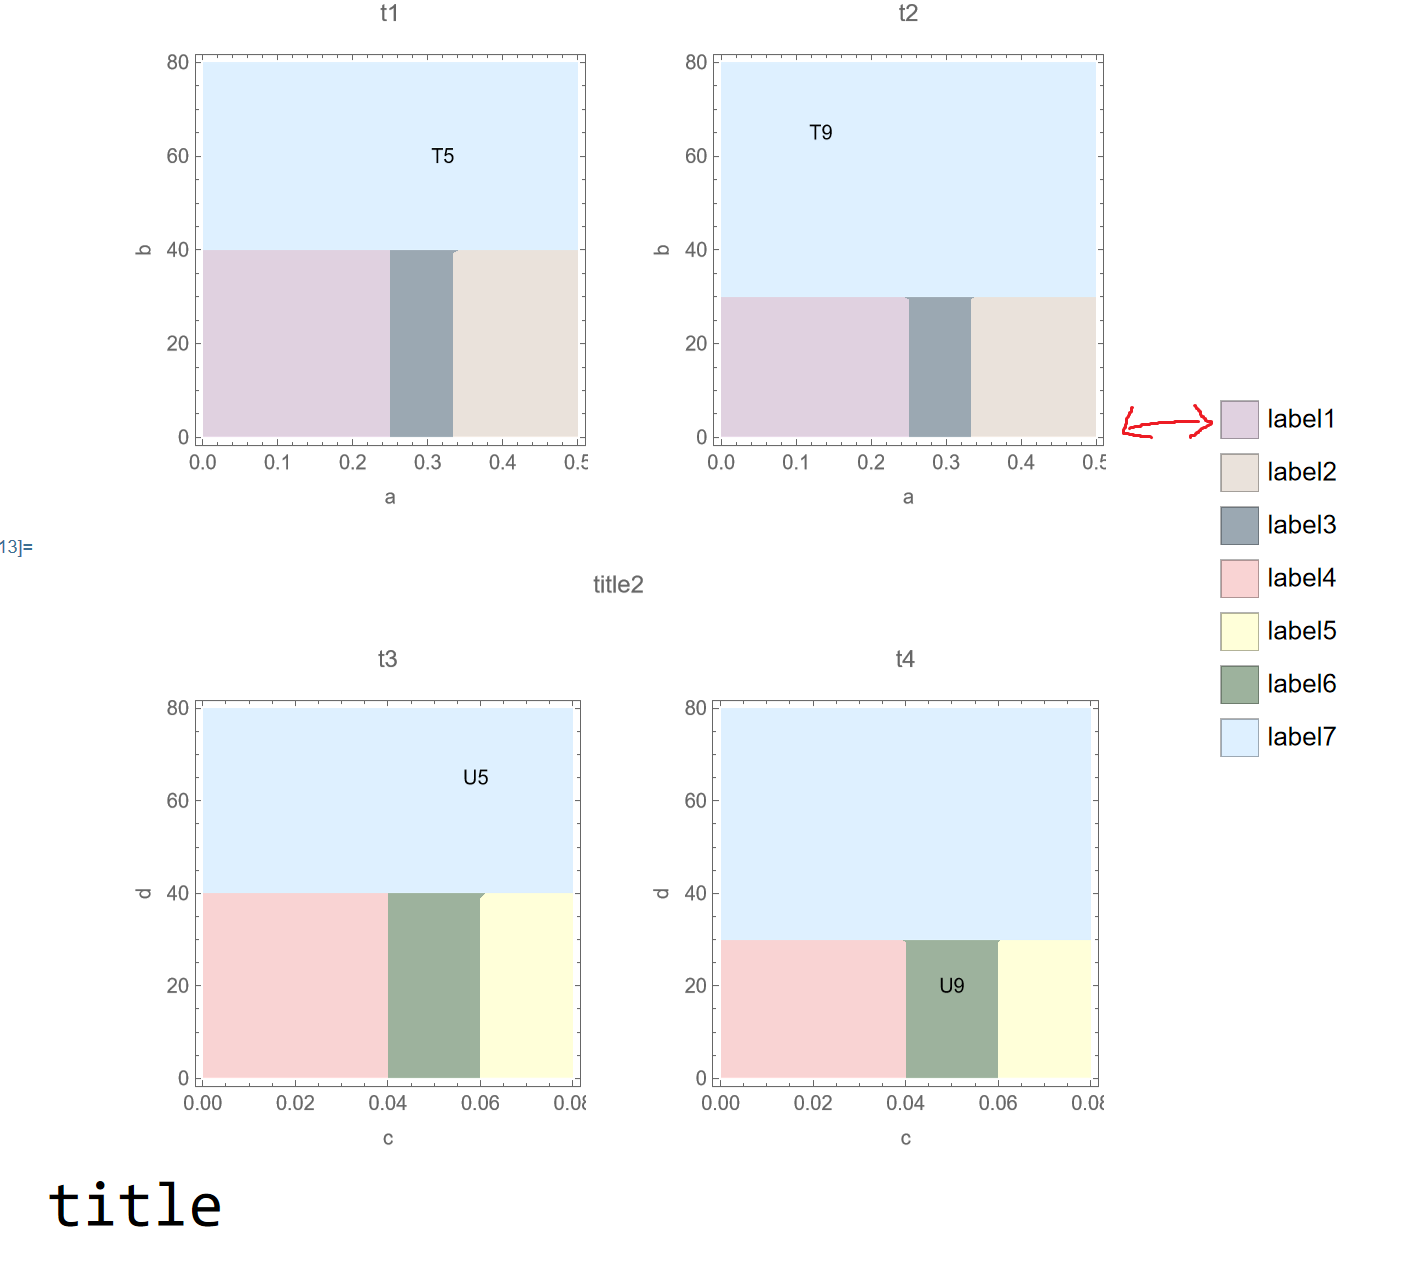
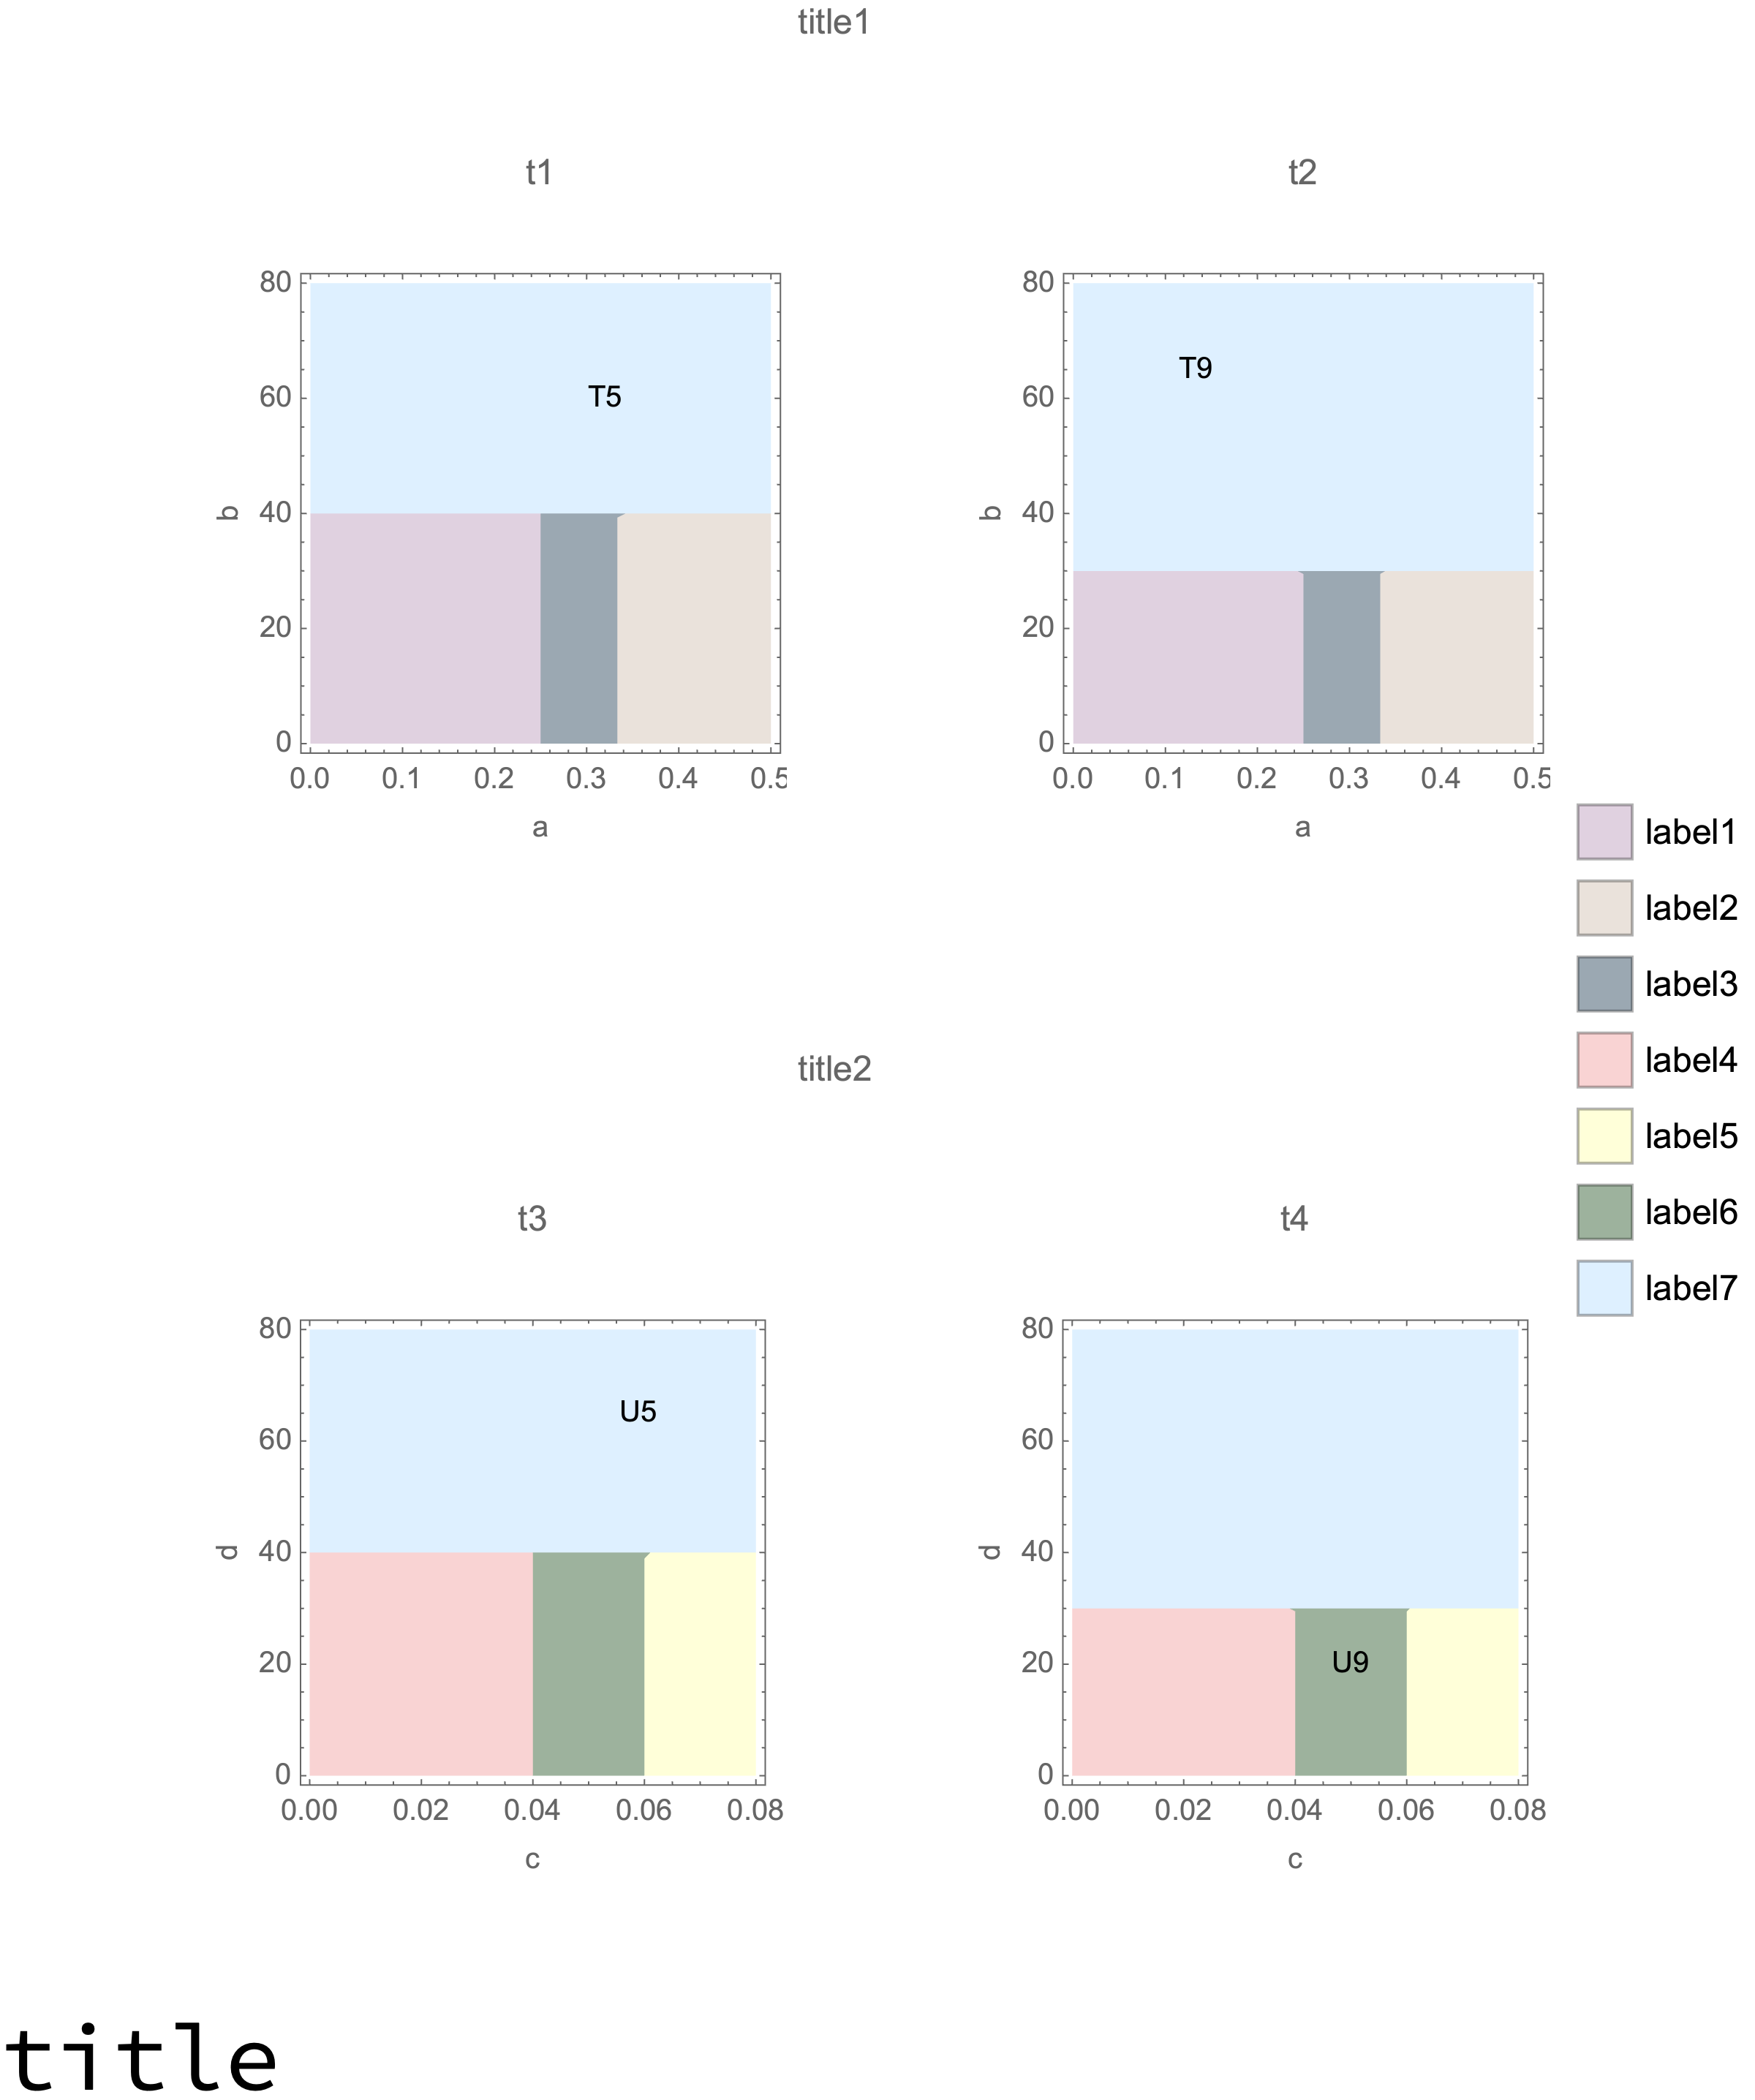
I'm trying to control (more precisely, I want to shorten it) the amount of space between the legend and the plot, but haven't been able to do so.
Here is an example; functions are MWE, but I've included all options I need (my attempts messed with some of those options):
p11 =  RegionPlot[{0 <= k <= 1/2 && 0 <= l <= 80,
            l < 40 && k > 1/3,
            l < 40 && 1/4 < k < 1/3 ,
            l < 40 && k < 1/4 ,
            l > 40
   } , {k, 0, 1/2}, {l, 0, 80},
  PlotStyle -> {Darker[LightBlue, 0.3], Darker[LightBrown, 1/40],
    Darker[LightBlue, 0.3], Darker[LightPurple, 1/15], LightBlue},
  BoundaryStyle -> None]

p12 =  RegionPlot[{0 <= k <= 1/2 && 0 <= l <= 80,
            l < 30 && k > 1/3,
            l < 30 && 1/4 < k < 1/3 ,
            l < 30 && k < 1/4 ,
            l > 30
   } , {k, 0, 1/2}, {l, 0, 80},
  PlotStyle -> {Darker[LightBlue, 0.3], Darker[LightBrown, 1/40],
    Darker[LightBlue, 0.3], Darker[LightPurple, 1/15], LightBlue},
  BoundaryStyle -> None]

p21 =  RegionPlot[{0 <= g <= .08 && 0 <= l <= 80,
            l < 40 && g > .06,
            l < 40 && .06 > g > .04 ,
            l < 40 && .04 > g > 0 ,
            l > 40
   } , {g, 0, .08}, {l, 0, 80},
  PlotStyle -> {Darker[LightGreen, 0.3], LightYellow,
    Darker[LightGreen, 0.3], Darker[LightRed, 1/40], LightBlue},
  BoundaryStyle -> None]

p22 =  RegionPlot[{0 <= g <= .08 && 0 <= l <= 80,
            l < 30 && g > .06,
            l < 30 && .06 > g > .04,
            l < 30 && .04 > g > 0 ,
            l > 30
   } , {g, 0, .08}, {l, 0, 80},
  PlotStyle -> {Darker[LightGreen, 0.3], LightYellow,
    Darker[LightGreen, 0.3], Darker[LightRed, 1/40], LightBlue},
  BoundaryStyle -> None]

pp11 = Show[p11, FrameLabel -> {"a", "b"}, PlotLabel -> "t1",
  Epilog -> {Text["T5", {.32, 60}]}]

pp12 = Show[p12, FrameLabel -> {"a", "b"}, PlotLabel -> "t2",
  Epilog -> {Text["T9", {.133, 65}]}]

pp21 = Show[p21, FrameLabel -> {"c", "d"}, PlotLabel -> "t3",
  Epilog -> {Text["U5", {.059, 65}]}]

pp22 = Show[p22, FrameLabel -> {"c", "d"}, PlotLabel -> "t4",
  Epilog -> {Text["U9", {.05, 20}]}]

twoplots1 = Show[GraphicsRow[{pp11, pp12}], PlotLabel -> "title1"]
twoplots2 = Show[GraphicsRow[{pp21, pp22}], PlotLabel -> "title2"]
fourplots = GraphicsGrid[{{twoplots1} , {twoplots2} }]

finalplot = Show[
  Legended[Labeled[fourplots, Style["title", 32], {{Bottom, Left}}],
   SwatchLegend[{Darker[LightPurple, 1/15], Darker[LightBrown, 1/40],
     Darker[LightBlue, 0.3], Darker[LightRed, 1/40], LightYellow,
     Darker[LightGreen, 0.3], LightBlue}, {"label1", "label2",
     "label3", "label4", "label5", "label6", "label7"},
    LegendMarkerSize -> 20]]]
Ps.: the last tick value (x-axis) appears as cut. However, it displays correctly in the exported .eps for LaTeX use.


