3
$\begingroup$

I could not find something similar. Suppose that I want the lines y=1 and x=1. I can do it with Plot and Epilog or GridLines. But how can I insert the representation of the vertical line in a legend that contains also the function y=1?

P.s. I am writing the message with the mobile phone. No access to Mathematica right now.

$\endgroup$

2 Answers 2

8
$\begingroup$

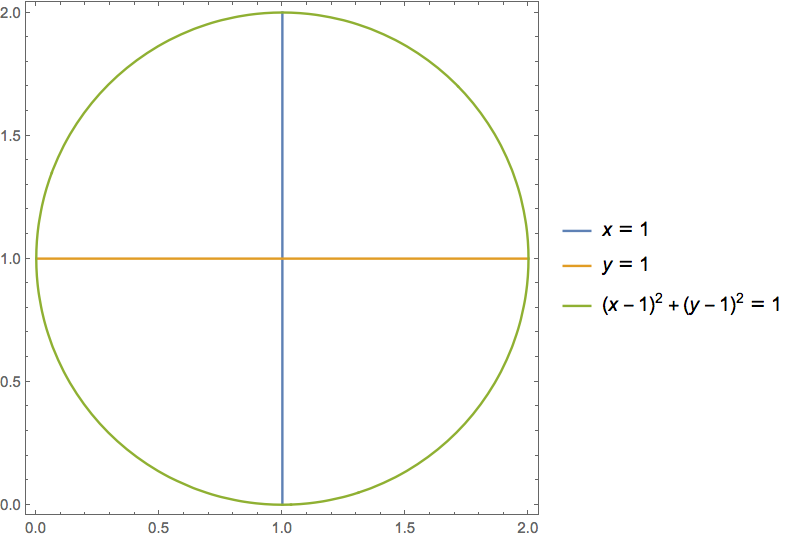
You can use ContourPlot

ContourPlot[
 {x == 1, y == 1, (x - 1)^2 + (y - 1)^2 == 1},
 {x, 0, 2}, {y, 0, 2},
 PlotLegends -> "Expressions"]

enter image description here

$\endgroup$
5
$\begingroup$

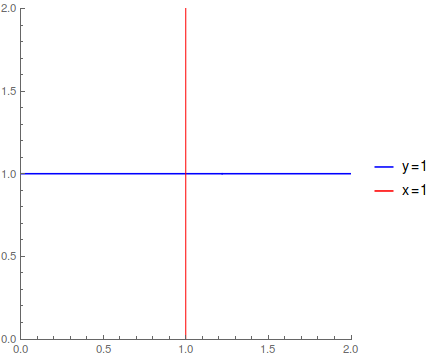
There's also this hacky way:

Plot[{1, 100 Sign[x - 1]}, {x, -3, 3}, PlotRange -> {{0, 2}, {0, 2}}, 
 PlotStyle -> {Blue, Red}, ExclusionsStyle -> Red, AspectRatio -> 1, 
 PlotLegends -> {"y=1", "x=1"}]

enter image description here

$\endgroup$

Your Answer

By clicking “Post Your Answer”, you agree to our terms of service and acknowledge you have read our privacy policy.

Not the answer you're looking for? Browse other questions tagged or ask your own question.