Let's plot a parametric function $(x_s(u,v), \:y_s(u,v))$ on some $uv$ domain as shown below with an annulus as example.
    xs[u_, v_] := (1/4 - I/4)*Sqrt[Pi]*(-Erf[(1/2 + I/2)*u] + Erf[(1/2 +
   I/2)*(u - I*v)] - Erfi[(1/2 + I/2)*u] + Erfi[(1/2 + I/2)*(u + I*v)]);

    ys[u_, v_] := (1/4 + I/4)*Sqrt[Pi]*(-Erf[(1/2 + I/2)*u] + Erf[(1/2 +
  I/2)*(u - I*v)] + Erfi[(1/2 + I/2)*u] - Erfi[(1/2 + I/2)*(u + I*v)]);

  ParametricPlot[{{xs[u, v], ys[u, v]}}, Element[{u, v}, Annulus[{1, 1}, {0.5, 1}]]]
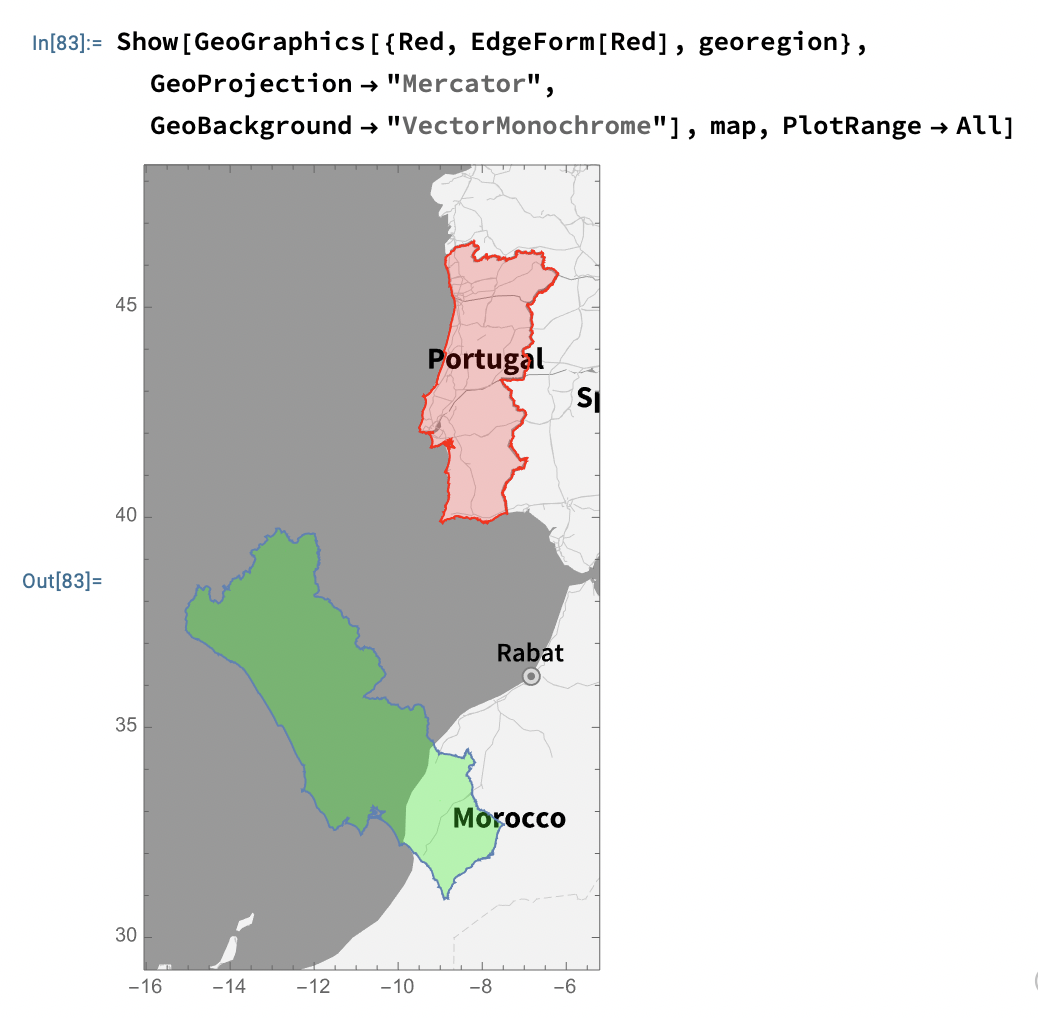
Now, I wish to take as domain, instead of an annulus, some geographical region, for instance Portugal. Up to now I've learned to plot such regions using
GeoGraphics[{Polygon[Entity["Country", "Portugal"]]}, GeoBackground -> None]
but how to convert that plot into a mathematical set where I could evaluate ParametricPlot ?

