3
$\begingroup$

I need to mark some objects in accordance with their coordinates (for example, in the form of blue point). And I found out two ways to realise it:

Option 1.

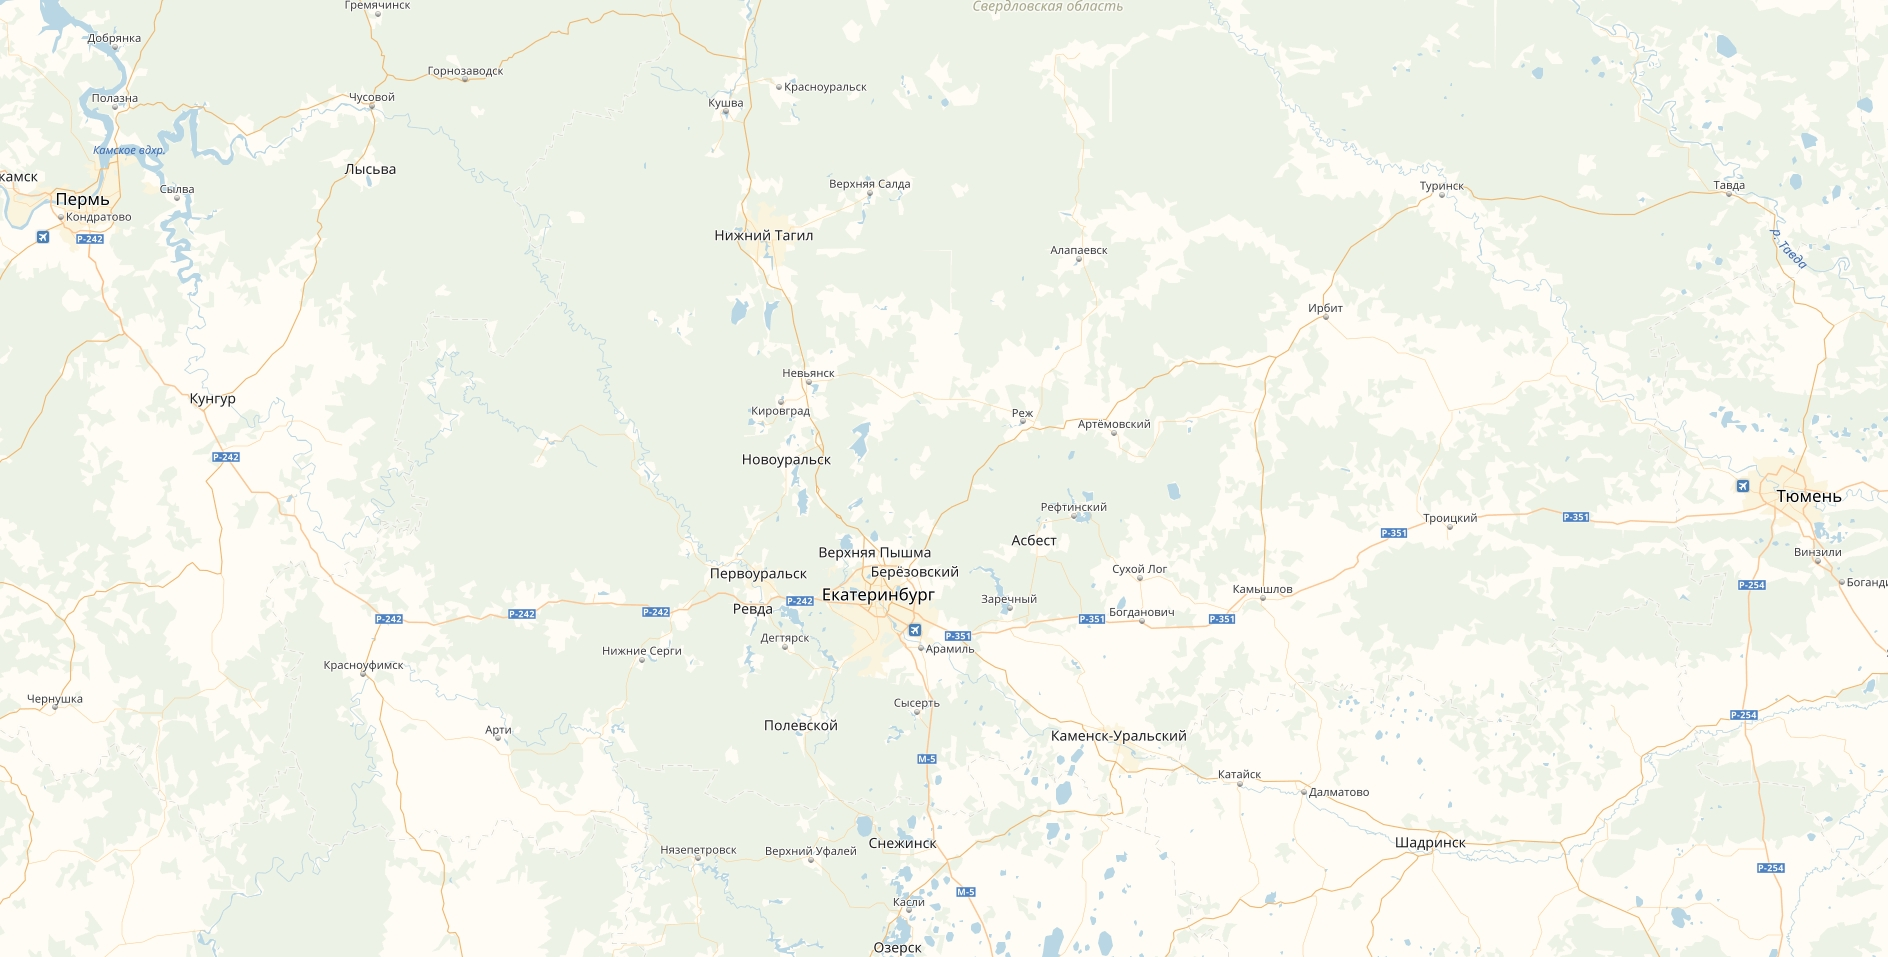
If I have the necessary map (called "EKB") and know the coordinates of image' corners I can somehow to mark the objects. My way is based on some answers I met:

enter image description here

UpperLeftCorner = {FromDMS["58\[Degree]36'01.89''N"], 
   FromDMS["55\[Degree]46'24.20''E"]};
LowerLeftCorner = {FromDMS["55\[Degree]44'59.75''N"], 
   FromDMS["55\[Degree]46'24.20''E"]};
LowerRightCorner = {FromDMS["55\[Degree]44'59.75''N"], 
   FromDMS["66\[Degree]08'20.36''E"]};
UpperRightCorner = {FromDMS["58\[Degree]36'01.89''N"], 
   FromDMS["66\[Degree]08'20.36''E"]};

CoordMapEKB = {UpperLeftCorner, LowerLeftCorner, LowerRightCorner, 
  UpperRightCorner};

Beloyark = {56.842034, 61.319775};
NovoSverdlov = {56.839909, 60.841127};
SredneUralsk = {57.000236, 60.463666};

MaskEKB = 
     Graphics[{Blue, PointSize[Large], Point[GeoPosition[{Beloyark, NovoSverdlov, SredneUralsk}]]}, 
      PlotRange -> Thread[{0, ImageDimensions[EKB]}]];


Show[EKB, Graphics[{Blue, MaskEKB[[1]], MaskEKB[[2]]}]]

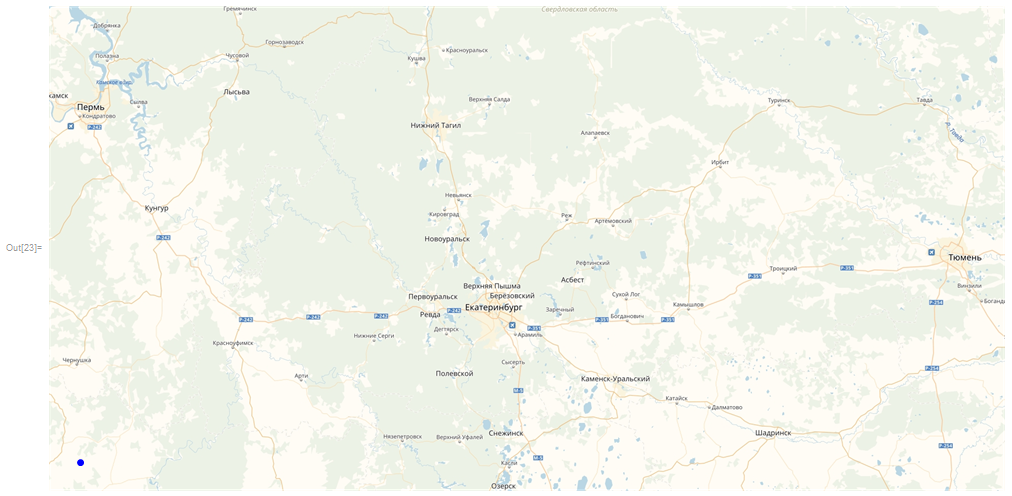
enter image description here

As far as I understood, the blue point reflects the position of the necessary object but "in the space of image dimension".

Option 2.

It was recommended in comments:

GeoListPlot[GeoPosition /@ {Beloyark, NovoSverdlov, SredneUralsk}, 
 GeoRange -> 
  GeoBoundsRegion[{{CoordMapEKB[[2, 1]], 
     CoordMapEKB[[1, 1]]}, {CoordMapEKB[[1, 2]], 
     CoordMapEKB[[3, 2]]}}], PlotMarkers -> Automatic]

It really impressed me but what about the image quality? Why it is so bad?

So, Five questions:

  1. How to mark and note the names of the objects on the image knowing the coordinates?

  2. What is wrong with my code? Do I miss something?

  3. Is it possible to mark the objects another way (in both Options)? For instance, using the images:

enter image description here

  1. How to connect these objects by the straight line or polyline (zigzag)?

  2. Is it possible somehow to improve the quality in the Option 2?

$\endgroup$
2
  • 1
    $\begingroup$ Hi, please write your code into your post, rather than as images - nobody wants to have to type it out for themselves. You should look at GeoPosition and GeoListPlot - roughly, something like GeoListPlot[GeoPosition/@{Bel, Nov, Sred}, GeoRange-> GeoBoundsRegion[...that region...]] should work. $\endgroup$
    – Carl Lange
    Commented Mar 2, 2019 at 20:46
  • $\begingroup$ The question will be edited in accordance with help center soon. I am sorry for misunderstanding. $\endgroup$ Commented Mar 3, 2019 at 19:11

2 Answers 2

5
$\begingroup$

I would recommend reading the documentation for the Geo* functions, since it seems like you may not be aware of a lot of the useful built-ins for this. I hope this helps as a starting point for you to learn about GeoGraphics and so on - there's a lot of powerful functionality available there.

To begin with, I've simplified your starting code:

bounds = GeoBoundingBox[{GeoPosition@{"58\[Degree]36'01.89''N", 
     "55\[Degree]46'24.20''E"}, 
   GeoPosition@{"55\[Degree]44'59.75''N", "66\[Degree]08'20.36''E"}}]

beloyark = GeoPosition[{56.842034, 61.319775}];
novoSverdlov = GeoPosition[{56.839909, 60.841127}];
sredneUralsk = GeoPosition[{57.000236, 60.463666}];

GeoPosition is able to take DMS coordinates directly. Furthermore you don't need all four corners - only two opposing corners, and then you can use GeoBoundingBox. It's not actually clear to me that you really definitely want to use this bounding box, since your three points are all quite close together at that scale.

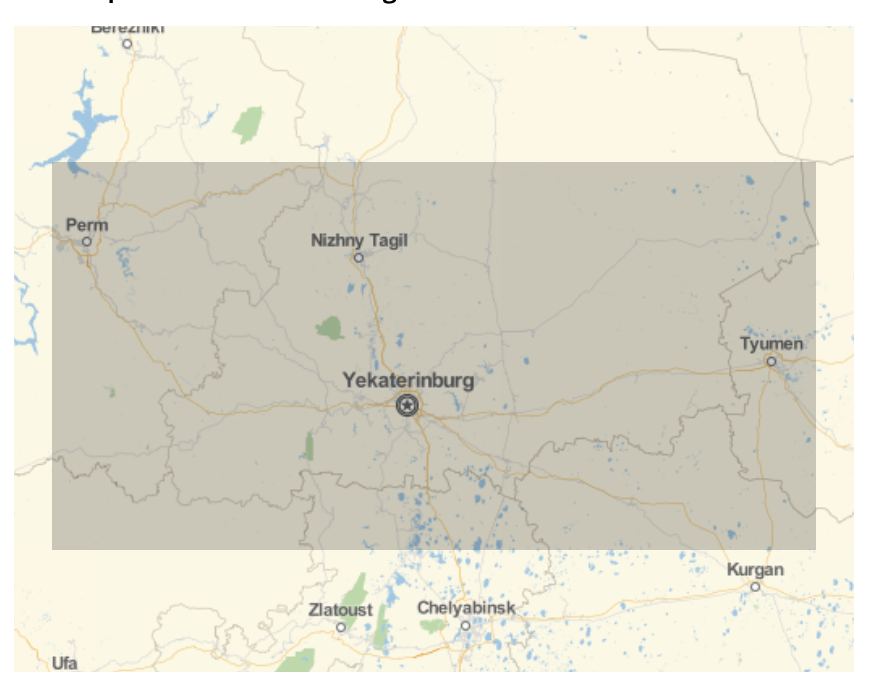
Anyways, now that we have those points, we can draw the bounding box simply, just to make sure we got it right:

GeoGraphics@GeoBoundsRegion@bounds

enter image description here

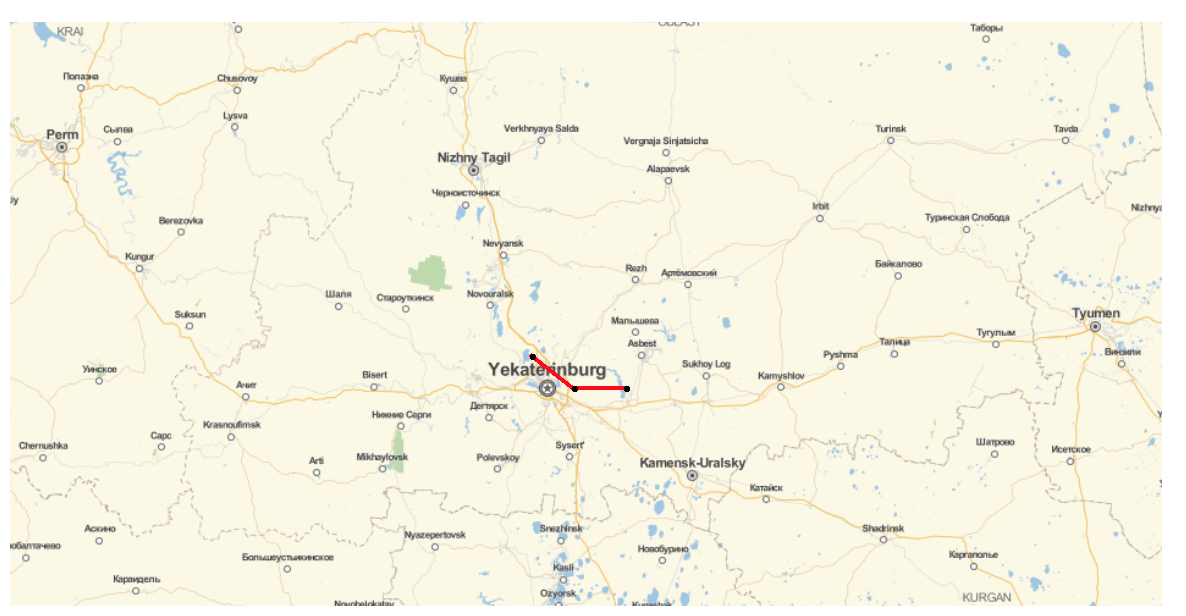
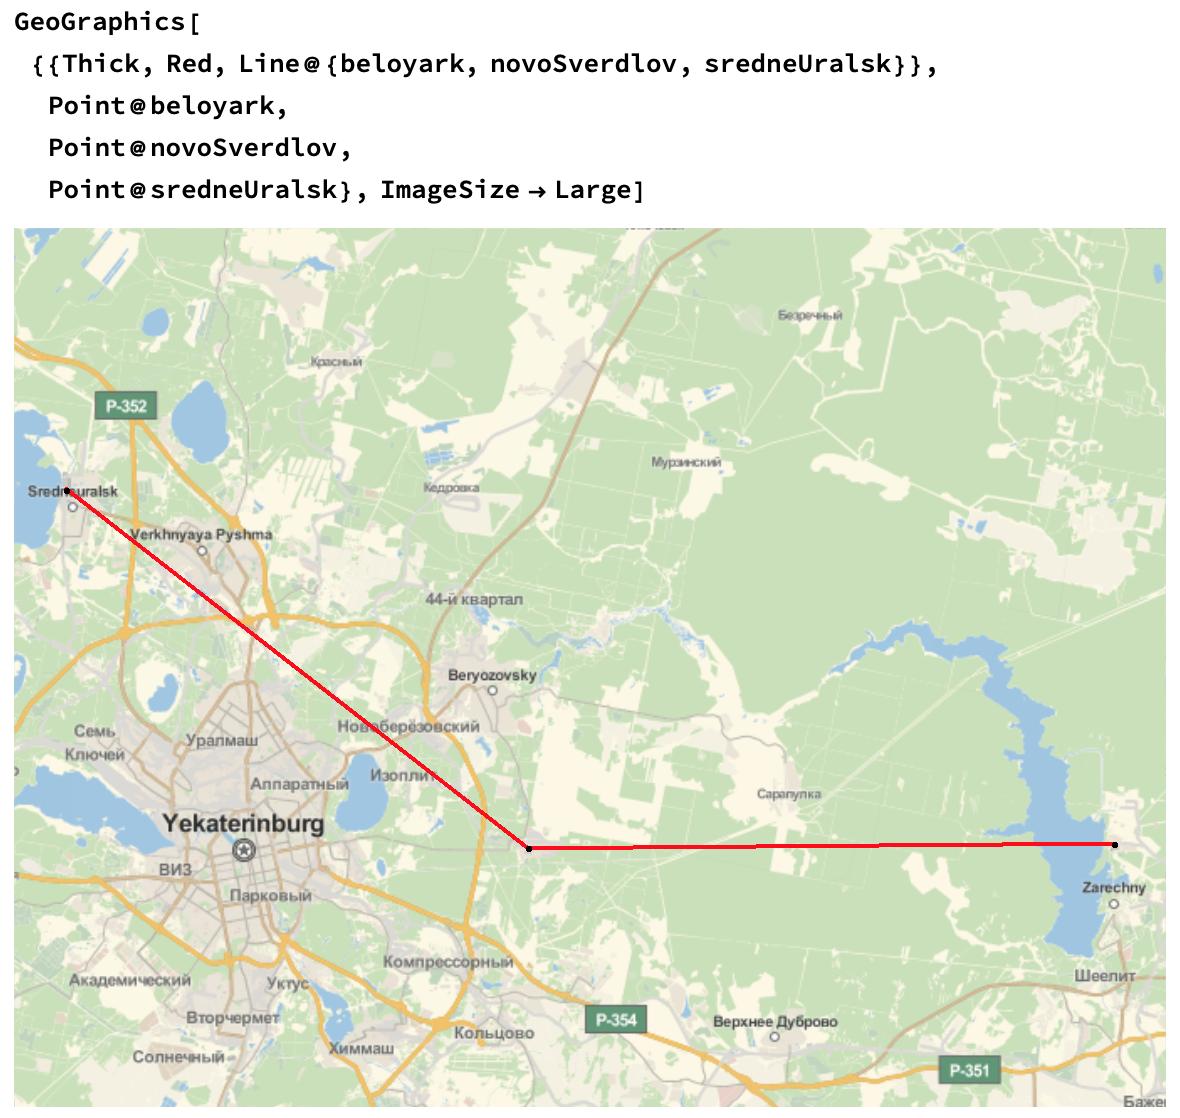
Now, we can draw your points, with a line between each of them (using Line:

GeoGraphics[
 {{Thick, Red, Line@{beloyark, novoSverdlov, sredneUralsk}},
  Point@beloyark,
  Point@novoSverdlov,
  Point@sredneUralsk}, GeoRange -> bounds, ImageSize -> Large]

enter image description here

Above, we use GeoRange -> bounds because that's what you asked for, but personally I think using the Automatic setting is better:

enter image description here

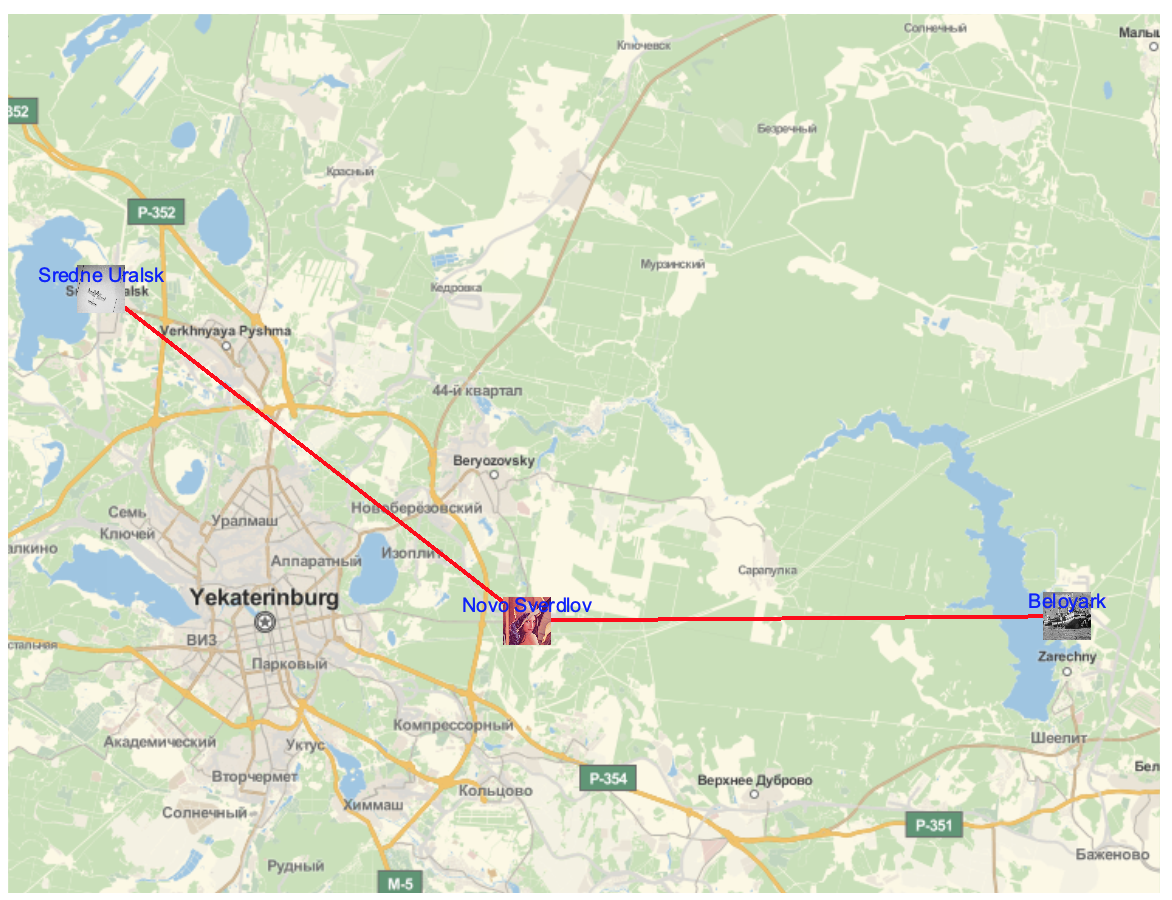
Finally, let's add some images and labels, as you requested. Above, I used Point, but now we'll use GeoMarker to add more interesting markers. Because your images aren't separated, I just used example images, but you can replace them with any image you like.

GeoGraphics[
 {{Thick, Red, Line@{beloyark, novoSverdlov, sredneUralsk}},
  {GeoMarker[beloyark, ExampleData[{"TestImage", "Boat"}]],
   GeoMarker[beloyark, "Beloyark", "Alignment" -> Bottom, 
    "Scale" -> [email protected], "Color" -> Blue]},
  {GeoMarker[novoSverdlov, ExampleData[{"TestImage", "Lena"}]],
   GeoMarker[novoSverdlov, "Novo Sverdlov", "Alignment" -> Bottom, 
    "Scale" -> [email protected], "Color" -> Blue]},
  {GeoMarker[sredneUralsk, ExampleData[{"TestImage", "Airplane"}]],
   GeoMarker[sredneUralsk, "Sredne Uralsk", "Alignment" -> Bottom, 
    "Scale" -> [email protected], "Color" -> Blue]}},
 GeoRangePadding -> Quantity[5, "Kilometers"],
 ImageSize -> Large]

enter image description here

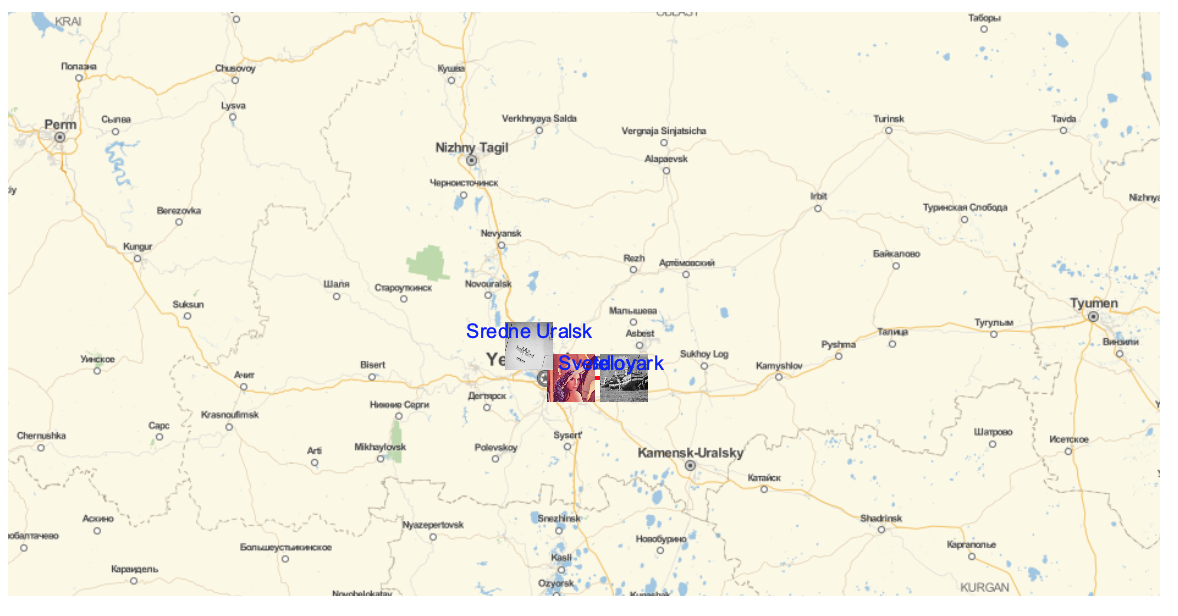
Finally, here it is with the original bounds you specify (which, again, is too large in my opinion):

enter image description here

$\endgroup$
5
  • $\begingroup$ It is really useful, thanks! But my main idea is to make the map of high quality and export it after (and print for educational purposes). Unfortunately, I do not know how to export the image representing the map. Something like Export["map.png", %, ImageResolution -> 900] does not work properly. That is why my idea was to upload the high resolution map and work with it. And, as you have already mentioned correct - the marker of the objects turned out too large $\endgroup$ Commented Mar 5, 2019 at 8:42
  • 1
    $\begingroup$ I didn't see that in your original question, sorry. Consider looking at RasterResolution, and also increasing GeoZoomLevel. You can also make the marker images smaller by modifying the "Scale" parameter. $\endgroup$
    – Carl Lange
    Commented Mar 5, 2019 at 10:06
  • $\begingroup$ Yes, it is my bad. Perhaps, I wasn't quite specific, sorry. Anyway, I'll try do something with your recommendations. But, I think it is worth mention that another reason why I decided to work with my image (not with WM geomap) is that my image better fits to my purposes (I don't like the GeoSource used in WM, though it can be fixed any way to fit the needs, I guess). And, also, in this case, I can upload the image which already has high quality. At the first blush, it seemed to me that it would simpler than working with WM GeoMap. Anyway, thanks a lot for your recommendations and help. $\endgroup$ Commented Mar 5, 2019 at 10:27
  • 2
    $\begingroup$ @vladpopovcev Aha, it becomes clearer now. Another option is to use something like GeoGraphics[{bounds, GeoStyling["GeoImage", yourImage]}] to project your exact image, and then use your points as above. $\endgroup$
    – Carl Lange
    Commented Mar 5, 2019 at 11:37
  • $\begingroup$ Wow, GeoStyling gives a lot! It works, thanks! But the given result is the WM GeoMap of the bad quality within the necessary limits and, as I mentioned before, it doesn't fit to educational purposes (especially printing). Hope, I express myself in an understandable way ._. $\endgroup$ Commented Mar 5, 2019 at 13:02
0
$\begingroup$

Alright, finally I've brought if off by means of provided some help (thanks to Carl Lange).

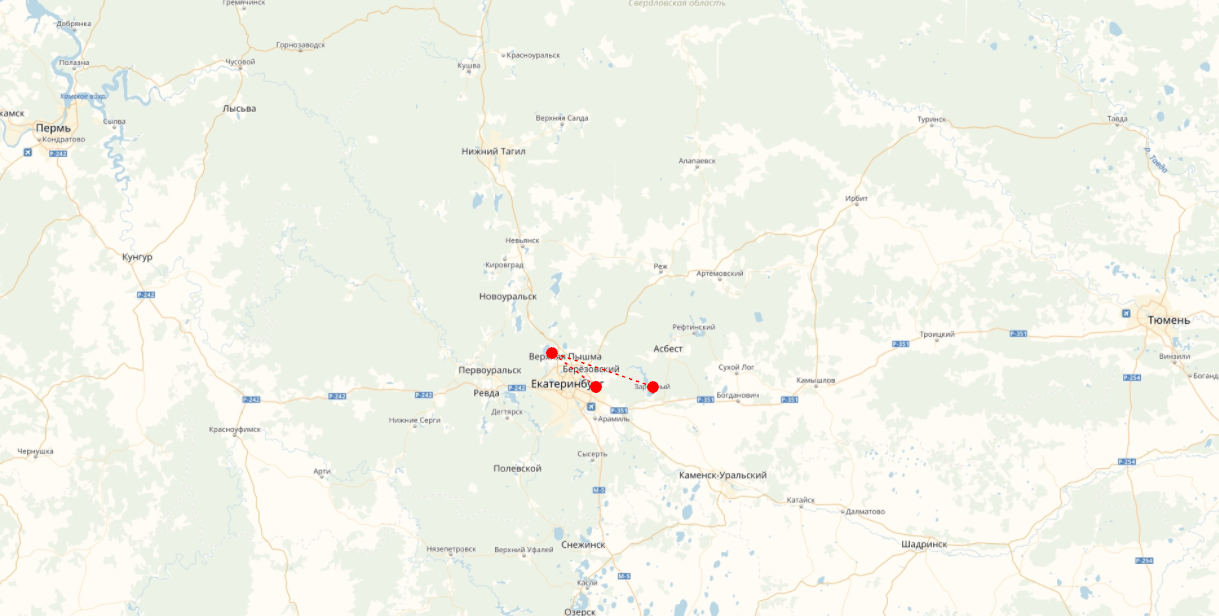
What I wanted to get is:

EKB = <<Picture of EKB here>>

LowerLeftCorner = {FromDMS["55\[Degree]44'59.75''N"], 
   FromDMS["55\[Degree]46'24.20''E"]};
UpperRightCorner = {FromDMS["58\[Degree]36'01.89''N"], 
   FromDMS["66\[Degree]08'20.36''E"]};

Beloyark1 = {56.842034, 61.319775};
NovoSverdlov1 = {56.839909, 60.841127};
SredneUralsk1 = {57.000236, 60.463666};

GeoGraphics[{Red, PointSize[0.01], 
  Point@GeoPosition[{Beloyark1, NovoSverdlov1, SredneUralsk1}], Thick,
   Dashed, GeoPath[{Beloyark1, SredneUralsk1, NovoSverdlov1}]}, 
 GeoBackground -> GeoStyling[{"Image", EKB}], 
 GeoRange -> Transpose@{LowerLeftCorner, UpperRightCorner}]

what I need

Now it is Ok because in this case I can use necessary map (special one of high quality).

Moreover, I almost managed to use another objects instead of Red Point but, from my point of view, it is related to another topic.

Unfortunately, I couldn't increase the quality of the map given WM but, anyway, my main problem is solved.

$\endgroup$

Your Answer

By clicking “Post Your Answer”, you agree to our terms of service and acknowledge you have read our privacy policy.

Not the answer you're looking for? Browse other questions tagged or ask your own question.