2
$\begingroup$

In continuation the topics 1 and 2: I had the map "EKB" and I needed to mark some objects. Just for example:

AES=

aes

TECgas=

tecgas

DataSetEkb = Dataset[{
    <|"Names of Objects" -> "Beloyarskaya AES", "Power, MVt" -> 1485, 
     "Coordinates" -> {56.842034, 61.319775}, "Legend" -> AES |>,
    <|"Names of Objects" -> "Tumenskaya TEC-1", "Power, MVt" -> 681.7,
      "Coordinates" -> {57.147139, 65.606861}, "Legend" -> TECgas |>,
    <|"Names of Objects" -> "Tumenskaya TEC-2", "Power, MVt" -> 755, 
     "Coordinates" -> {57.086667, 65.626944}, "Legend" -> TECgas |>}];

Thanks to Sjoerd C. de Vries and Carl Lange I have:

ekbs = GeoGraphics[{GeoMarker[##, "Scale" -> Scaled[0.025]] & @@@ 
    Values@Normal@DataSetEkb[All, {"Coordinates", "Legend"}], 
   GeoMarker[#1, 
      Style[#2, Bold, Black, FontFamily -> "Times New Roman", 
       FontSize -> 14], "Alignment" -> Top, "Scale" -> [email protected]] & @@@
     Values@Normal@
      DataSetEkb[All, {"Coordinates", "Names of Objects"}]}, 
  GeoBackground -> GeoStyling[{"Image", EKB}], 
  GeoRange -> Transpose@{LowerLeftCorner, UpperRightCorner}, 
  ImageSize -> Full]

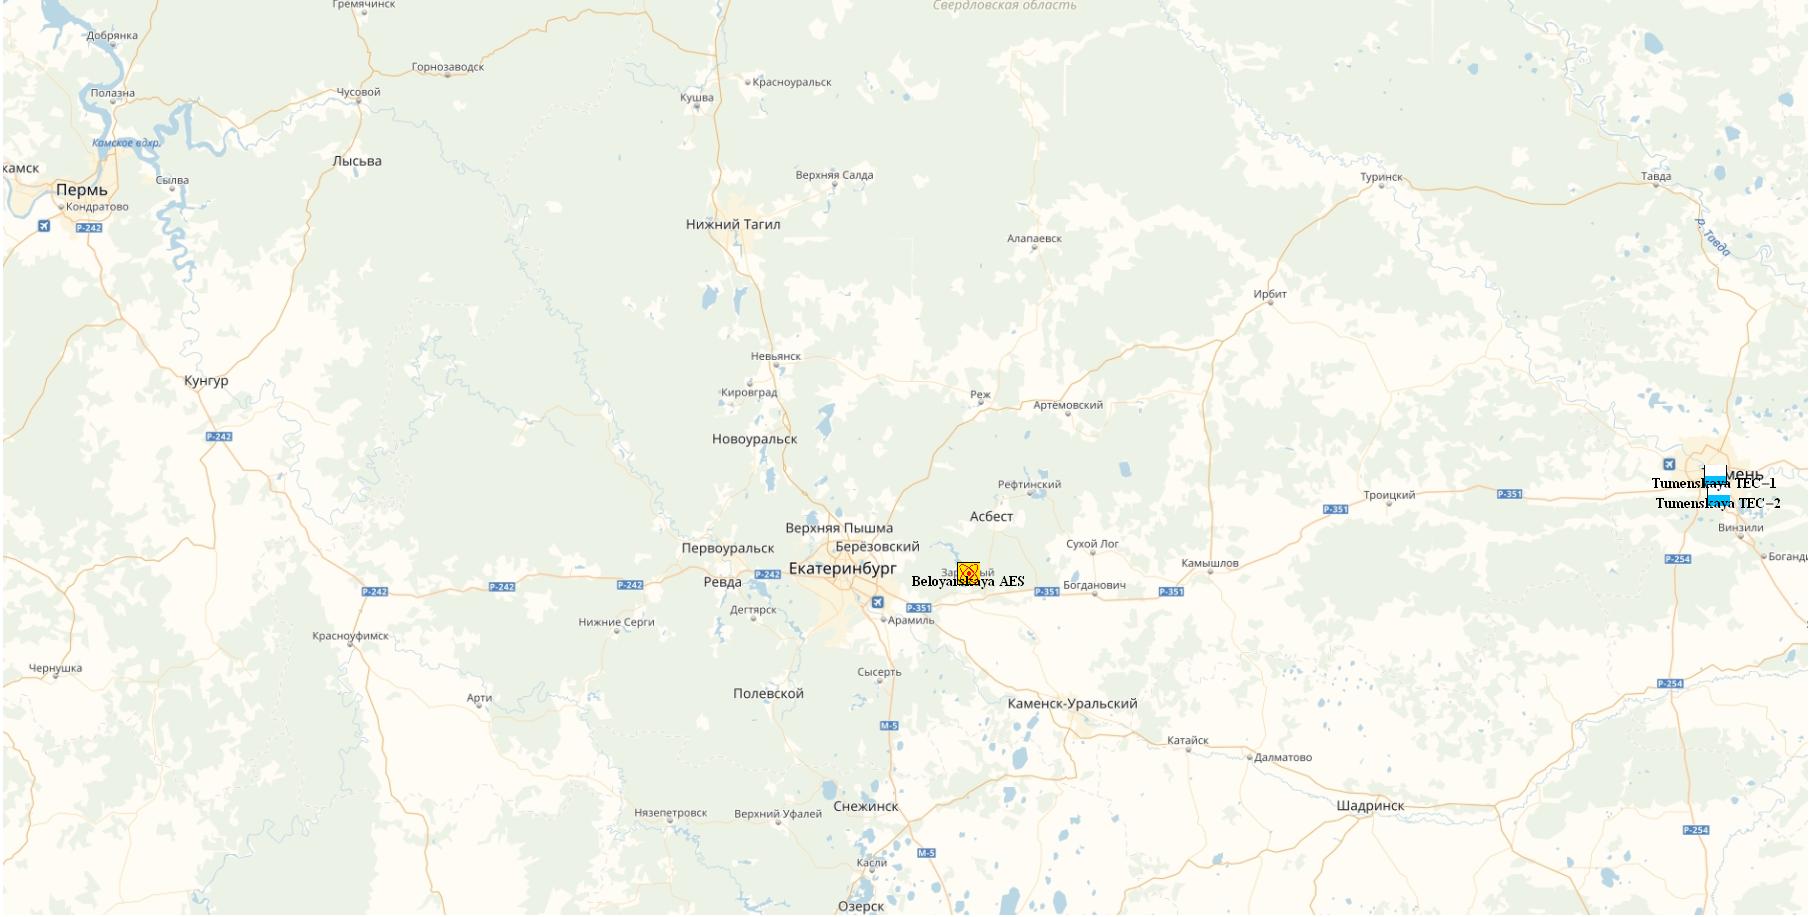
It gives nice way to mark the objects and add the text corresponding the object:

ekb1

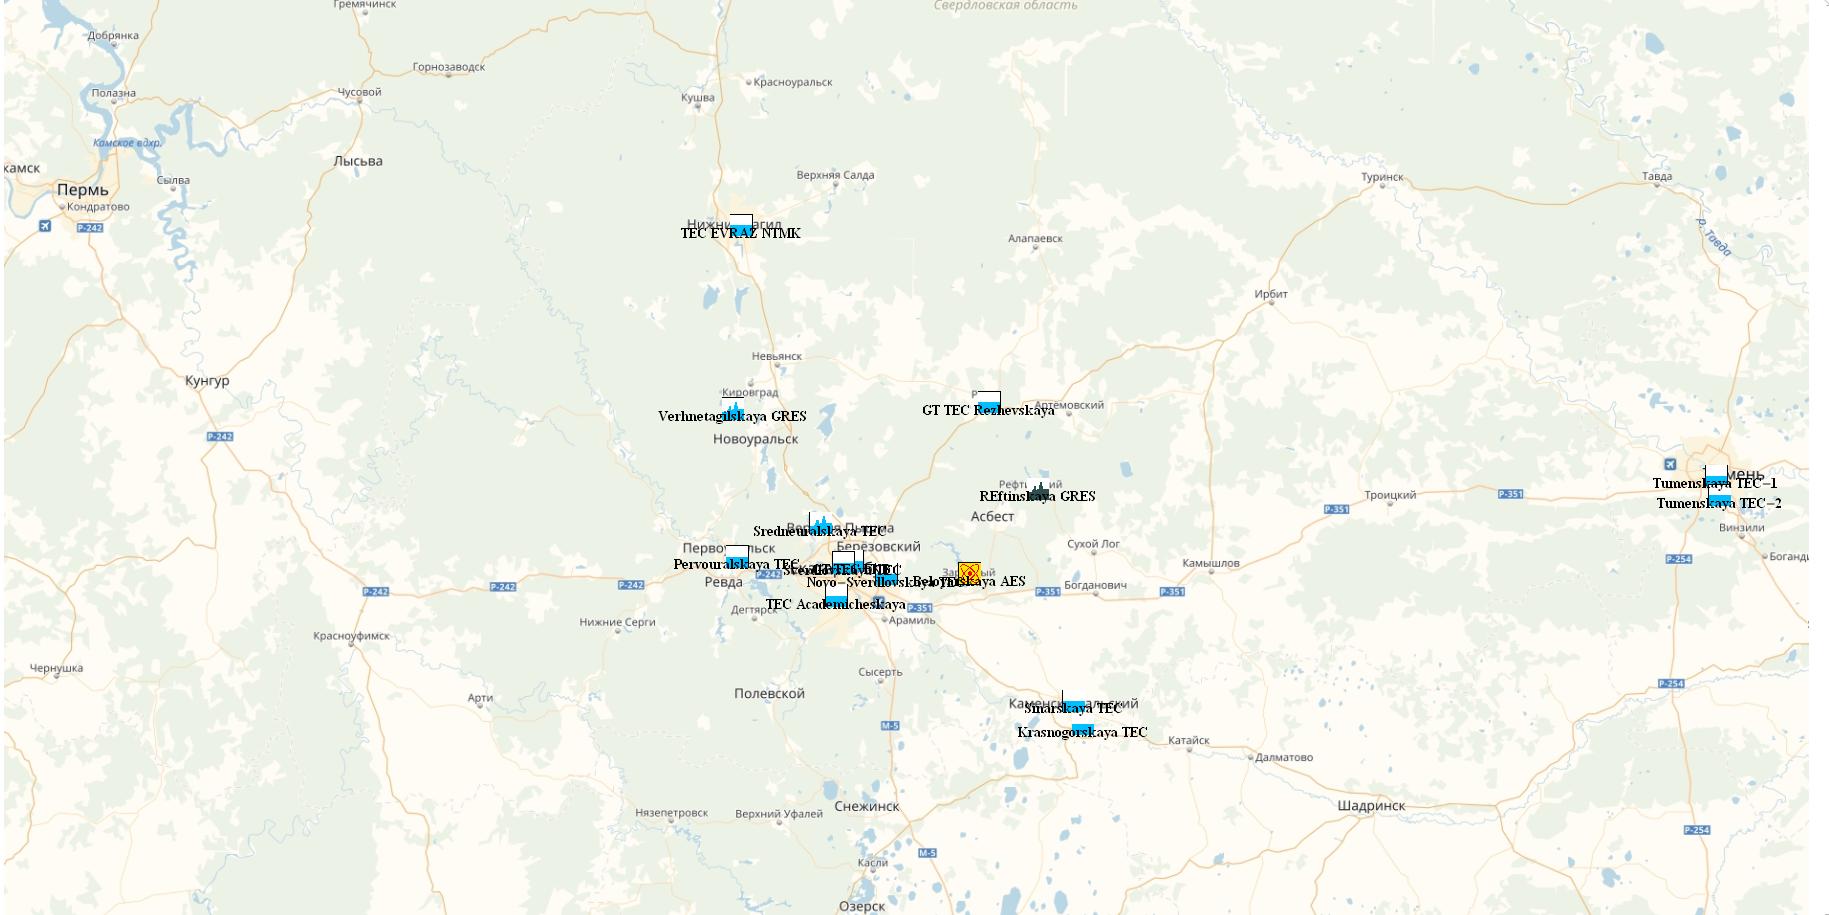
But what if the number of objects is large? In this case, I guess, it is more appropriate to realise something which would allow to add the text correctly ("seamlessly" and without "text overlay").

I mean, what can be done in order to avoid the "overlaying" like that:

ekbwrong

Based on the answers from here1, here2 and here3 I tried to make the GeoMaker for each object separately but something is wrong:

ekbes=GeoGraphics[
{GeoMarker[##,"Scale"\[Rule]Scaled[0.025]]&@@@Values@Normal@\
DataSetEkb[All,{"Coordinates","Legend"}],
GeoMarker[Normal@DataSetEkb[[1,3]],Text[Style[Normal@DataSetEkb[[1,1]]\
,Bold,Black],Normal@DataSetEkb[[1,3]],{-1.5,0}]],
GeoMarker[Normal@DataSetEkb[[2,3]],Text[Style[Normal@DataSetEkb[[2,1]]\
,Bold,Black],Normal@DataSetEkb[[2,3]],{-1.5,0}]],
GeoMarker[Normal@DataSetEkb[[3,3]],Text[Style[Normal@DataSetEkb[[3,1]]\
,Bold,Black],Normal@DataSetEkb[[3,3]],{-1.5,0}]]},
GeoBackground\[Rule]GeoStyling[{"Image",EKB}],
GeoRange\[Rule]Transpose@{LowerLeftCorner,UpperRightCorner},
ImageSize\[Rule]Full]
$\endgroup$
1
  • 2
    $\begingroup$ you can use Text[Style[Normal@DataSetEkb[[1, 1]], Bold, Black], GeoPosition@Normal@DataSetEkb[[1, 3]], {-1.5, 0}] instead of GeoMarker[Normal@DataSetEkb[[1, 3]], Text[Style[Normal@DataSetEkb[[1, 1]], Bold, Black], Normal@DataSetEkb[[1, 3]], {-1.5, 0}]]? $\endgroup$
    – kglr
    Commented Mar 13, 2019 at 23:19

1 Answer 1

1
$\begingroup$

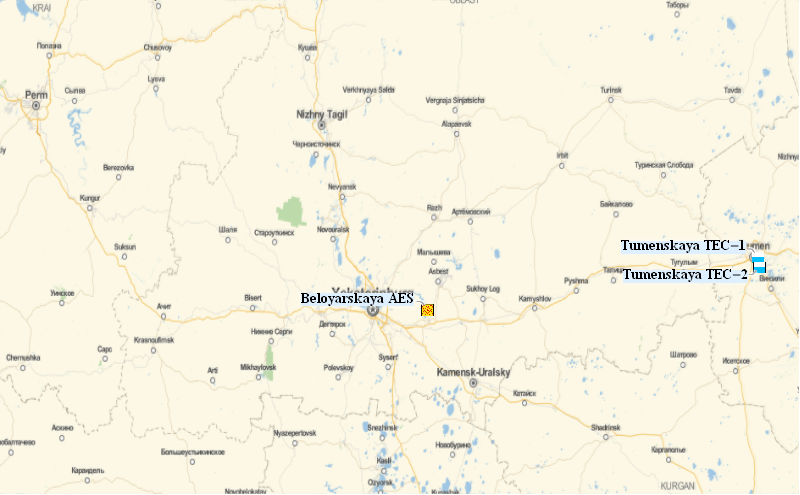
You may use ListPlot and Callout with Show and GeoGridPosition to enable automatic label positioning with reduced overlapping.

As of version 11.3 Callout is not a graphics primitive so it cannot be directly used in Epilog. However, you can still use Show to display multiple graphics together.

The next issue is that GeoGraphics is plotted by its GeoProjection transformation of lat/long coordinates into Cartesian coordinates; not its lat/long coordinates. Therefore, for ListPlot to match its plot to GeoGraphics the lat/long coordinates need to be transformed by the GeoProjection. GeoGridPosition does this transformation.

With DataSetEkb, AES, and TECgas as in the OP, and LowerLeftCorner and UpperRightCorner as in the posts linked in the OP. Then

LowerLeftCorner = {FromDMS["55\[Degree]44'59.75''N"], 
   FromDMS["55\[Degree]46'24.20''E"]};
UpperRightCorner = {FromDMS["58\[Degree]36'01.89''N"], 
   FromDMS["66\[Degree]08'20.36''E"]};

Show[
 GeoGraphics[
  {GeoMarker[##, "Scale" -> Scaled[0.025]] & @@@ 
    Values@Normal@DataSetEkb[All, {"Coordinates", "Legend"}]},
  GeoRange -> Transpose@{LowerLeftCorner, UpperRightCorner},
  GeoProjection -> "Mercator",
  ImageSize -> 800],
 DataSetEkb[
  ListPlot[#,
    PlotStyle -> Transparent,
    Axes -> None,
    PlotRange -> 
     Transpose[
      First@GeoGridPosition[GeoPosition@#, 
          "Mercator"] & /@ {LowerLeftCorner, UpperRightCorner}]] &,
  Callout[
    First@GeoGridPosition[GeoPosition@#["Coordinates"], "Mercator"], 
    Style[#["Names of Objects"], Bold, Black, 
     FontFamily -> "Times New Roman", FontSize -> 14, 
     Background -> LightBlue]
    ] &]
 ]

Mathematica graphics

The only extra bit is that ListPlot must have its PlotRange explicitly set to the GeoProjection transformed GeoRange of GeoGraphics. I think this is because Show gets its option values from the graphics it contains and since GeoGraphics does not have a PlotRange option then it gets it from ListPlot. Therefore, to see the entire map ListPlot needs to covering the same range of coordinates as GeoGraphics.

Hope this helps.

$\endgroup$
1
  • $\begingroup$ Thank you for detailed clarification! It is really helpful for me $\endgroup$ Commented Mar 14, 2019 at 16:01

Your Answer

By clicking “Post Your Answer”, you agree to our terms of service and acknowledge you have read our privacy policy.

Not the answer you're looking for? Browse other questions tagged or ask your own question.