@DanielHuber has mentioned the main issue but you'll also need to make some other changes: (1) Set a reasonable starting value for z0 and (2) Either increase the maximum number of iterations to 5000 (MaxIterations -> 5000) or replace FindFit with NonlinearModelFit.
Here is one approach:
nlm = NonlinearModelFit[data, {model, {w0 > 0, 1 < Msquared, z0 > 0}}, {w0, Msquared, {z0, 1}}, z];
nlm["ParameterConfidenceIntervalTable"]

Is having a 95% confidence interval for $M^2$ being $(0.969,1.393)$ good enough for your objective? If not, you need more data or data with less measurement error.
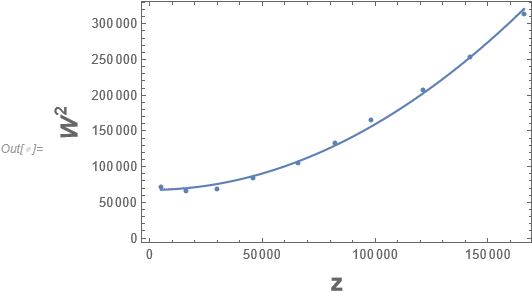
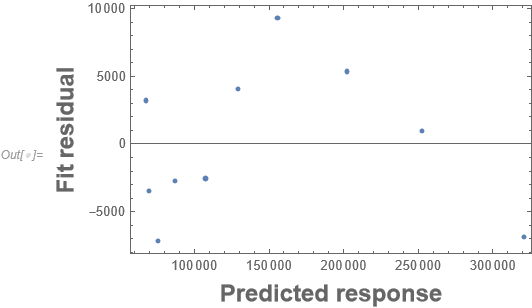
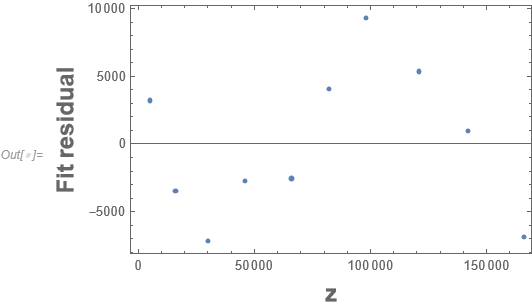
Looking at the fit and residuals is also helpful to decide on if the data matches the theoretical model. One essentially hopes for no apparent patterns.
Show[ListPlot[data], Plot[nlm[z], {z, Min[zdata], Max[zdata]}], Frame -> True,
 FrameLabel -> (Style[#, Bold, 18] &) /@ {"z", "\!\(\*SuperscriptBox[\(W\), \(2\)]\)"}]

ListPlot[Transpose[{nlm["PredictedResponse"], nlm["FitResiduals"]}], Frame -> True,
 FrameLabel -> (Style[#, Bold, 18] &) /@ {"Predicted response", "Fit residual"}]

ListPlot[Transpose[{zdata, nlm["FitResiduals"]}], Frame -> True,
 FrameLabel -> (Style[#, Bold, 18] &) /@ {"z", "Fit residual"}]

The residual fits don't look great as you have groups of neighboring points all above the fit or below the fit but you'll need to be the judge about that.
The webpage you mention is inadequate because it completely ignores any estimation of precision let alone what level of precision might be needed and any possible lack-of-fit.


z0such as{z0, 1}and (2) AddMaxIterations -> 5000toFindFit. And I might be in the minority with this but I would always useNonlinearModelFitin place ofFindFitasFindFitonly gives parameter estimates and no regression diagnostics asNonlinearModelFitdoes. (You're going to find that the estimate ofz0is 0.) $\endgroup$