2
$\begingroup$

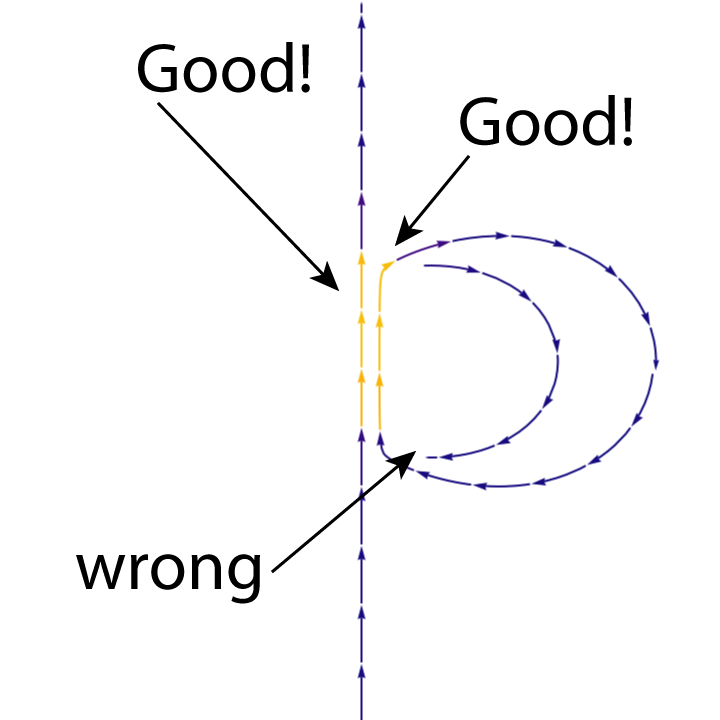
I want to plot the field lines of the B field of a bar magnet. The problem is that they have a very sharp bend when entering the magnet and Mathematica stops tracing the field lines.

Here is how I tried to do it:

(Notebook in Wolfram Cloud)

ψBarMagnetHeld  = WolframAlpha["magnetic potential rectangular bar magnet",{{"Result",1},"Input"}];
ψBarMagnet[{x_, y_, z_}, {a_, b_, c_}]=(ReleaseHold[ψBarMagnetHeld]/. {QuantityVariable[x_,y_]:>x})/Subscript[M, 0];
ℋBarMagnet[{x_, y_, z_}, {a_, b_, c_}]=-D[ψBarMagnet[{x, y, z}, {a, b, c}], {{x, y, z}}];
ℬBarMagnet[{x_, y_, z_}, {a_, b_, c_}]=ℋBarMagnet[{x,y,z},{a,b,c}] + {0,0,1}UnitStep[(a/2)^2-x^2]UnitStep[(b/2)^2-y^2]UnitStep[(c/2)^2-z^2];

crossSectionFieldPlot[field_, fieldStrength_] := 
 Block[{a = 1.5, b = 0.5, c = 5.5},
    StreamPlot[fieldStrength ,   {x, -a, a}, {z, -c, c}, 
    PlotRange -> {{-2 c, 2 c}, {-2 c, 2 c}}, 
    PlotRangeClipping -> True, VectorScale -> Medium, 
    StreamPoints -> {{0, 0}, {9, 0}, {6, 0}}, AspectRatio -> 1, Frame -> None]
 ]

crossSectionFieldPlot["ℬ",ℬBarMagnet[{x,0,z},{a,b,c}][[{1,3}]]]

The image below shows two field lines that work and one that is not tracked.

image shows two field lines that work and one that is not tracked

$\endgroup$
2
  • $\begingroup$ Please post the Mathematica code. $\endgroup$
    – cvgmt
    Commented Feb 26, 2022 at 10:17
  • $\begingroup$ The graph generated in v14.0 differs from the one in your Notebook in Wolfram Cloud. $\endgroup$
    – lotus2019
    Commented Mar 9 at 4:19

2 Answers 2

2
$\begingroup$

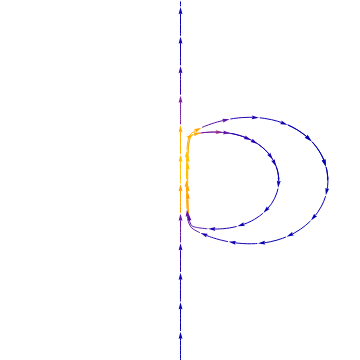
Add Scaled[1] in the third argument of StreamPoints to draw at least one complete stream of each stream point:

StreamPoints -> {{{0, 0}, {6, 0}, {9, 0}}, Automatic, Scaled[1]}

enter image description here

$\endgroup$
1
  • $\begingroup$ The graph obtained in v14.0 is incorrect. $\endgroup$
    – lotus2019
    Commented Mar 9 at 4:22
3
$\begingroup$

To show continues field line we use option StreamScale -> None

\[Psi]BarMagnetHeld  = 
  WolframAlpha[
   "magnetic potential rectangular bar magnet", {{"Result", 1}, 
    "Input"}];
\[Psi]BarMagnet[{x_, y_, z_}, {a_, b_, 
    c_}] = (ReleaseHold[\[Psi]BarMagnetHeld] /. {QuantityVariable[x_, 
        y_] :> x})/Subscript[M, 0];
\[ScriptCapitalH]BarMagnet[{x_, y_, z_}, {a_, b_, 
    c_}] = -D[\[Psi]BarMagnet[{x, y, z}, {a, b, c}], {{x, y, z}}];
\[ScriptCapitalB]BarMagnet[{x_, y_, z_}, {a_, b_, 
    c_}] = \[ScriptCapitalH]BarMagnet[{x, y, z}, {a, b, c}] + {0, 0, 
     1} UnitStep[(a/2)^2 - x^2] UnitStep[(b/2)^2 - 
      y^2] UnitStep[(c/2)^2 - z^2];

crossSectionFieldPlot[field_, fieldStrength_] := 
 Block[{a = 1.5, b = 0.5, c = 5.5},
    StreamPlot[fieldStrength ,   {x, -c, c}, {z, -c, c}, 
                               PlotRange -> All,
                                 StreamPoints -> Fine, 
   AspectRatio -> Automatic, Frame -> None, 
   StreamColorFunction -> "Rainbow", StreamScale -> None, 
   VectorPoints -> Fine, PerformanceGoal -> "Quality", 
   MaxRecursion -> 10]
  ]
bar2 = With[{a = 1.5,  c = 5.5}, 
  Graphics[{Opacity[.25], Rectangle[{-a, -c}/2, {a, c}/2]}, 
   Axes -> False, Frame -> False]];
Show[crossSectionFieldPlot[
  "\[ScriptCapitalB]", \[ScriptCapitalB]BarMagnet[{x, 0, z}, {a, b, 
     c}] [[{1, 3}]]] , bar2] 
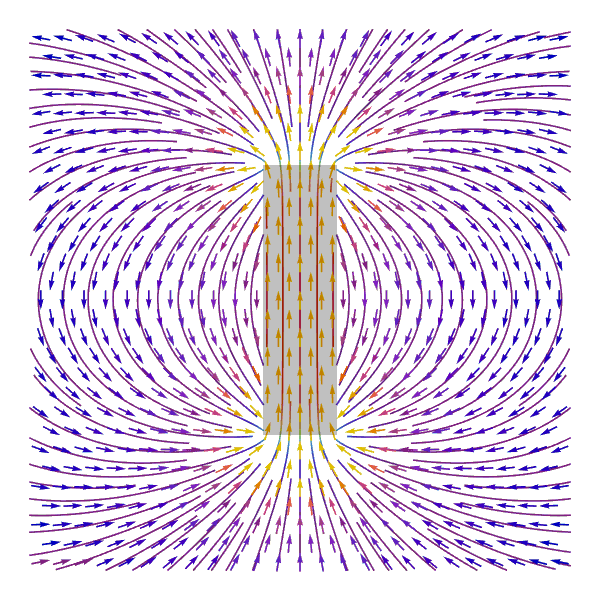
Figure 1

To solve the problem of broken lines we can use hand made code. First, we define interpolation functions for $B_x,B_z$ to exclude singularities as follows

Bx = Interpolation[
  Flatten[Table[{x, 
     z, \[ScriptCapitalB]BarMagnet[{x, 0., z}, {1.5, .5, 
        5.5}] [[1]]}, {x, 0, 10, .1}, {z, 0, 10, .1}], 1]];

Bz = Interpolation[
  Flatten[Table[{x, 
     z, \[ScriptCapitalB]BarMagnet[{x, 0., z}, {1.5, .5, 
        5.5}] [[3]]}, {x, 0, 10, .1}, {z, 0, 10, .1}], 1]];

Second, we compute field lines with

X1 = ParametricNDSolveValue[{z'[t] == Bz[x[t], z[t]], 
   x'[t] == Bx[x[t], z[t]], x[0] == x0, z[0] == z0}, 
  x, {t, 0, 1000}, {x0, z0}]; 
Z1 = 
     ParametricNDSolveValue[{x'[t] == Bx[x[t], z[t]], 
       z'[t] == Bz[x[t], z[t]], x[0] == x0, z[0] == z0}, 
      z, {t, 0, 1000}, {x0, z0}]; 

Finally we plot stream lines with StreamPlot[] and ParametricPlot[], and show in one plot

sp = StreamPlot[{Bx[x, z], Bz[x, z]} ,   {x, 0, 10}, {z, 0, 10}, 
                              PlotRange -> All,
                                StreamPoints -> Fine, 
  AspectRatio -> Automatic, Frame -> None, 
  StreamColorFunction -> "Rainbow", StreamScale -> None, 
  VectorPoints -> Fine, PerformanceGoal -> "Quality", 
  MaxRecursion -> 2];
ppxz = ParametricPlot[
   Table[{X1[x0, 0.01][t], Z1[x0, 0.01][t]}, {x0, .1, .5, .1}], {t, 0,
     1000}, PlotStyle -> Red];

Show[sp, ppxz]
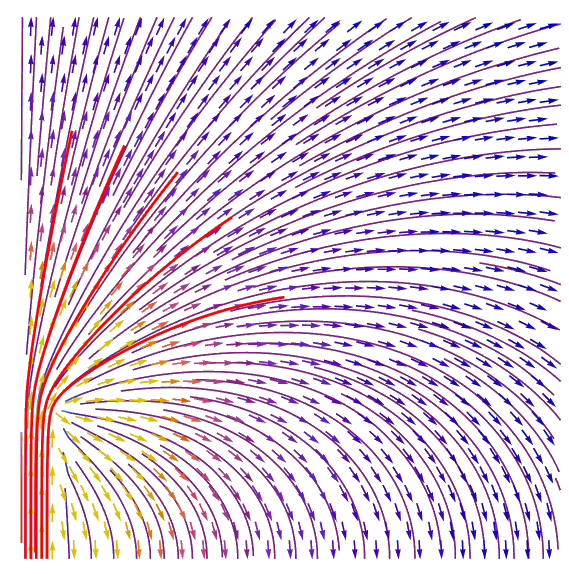
Figure 2

$\endgroup$
6
  • $\begingroup$ Thanks, but what I want is continuous field lines. In your example most of the field lines suddenly break. That is what I want to avoid! $\endgroup$
    – DrSvanHay
    Commented Feb 26, 2022 at 15:43
  • $\begingroup$ @DrSvanHay ah, I don't pay attention for your question. See update to my answer. $\endgroup$ Commented Feb 26, 2022 at 16:09
  • $\begingroup$ Hmm, not sure about that. With continous I mean closed loop. The field lines in a magnetic field are sourceless and I want to plot the closed loops the field lines must form. $\endgroup$
    – DrSvanHay
    Commented Feb 26, 2022 at 16:18
  • $\begingroup$ @DrSvanHay What is this picture for? Is it to illustrate continuous $\vec {B}$ field? $\endgroup$ Commented Feb 27, 2022 at 3:57
  • $\begingroup$ I ve added text to the illustration to clarify. The image shows two field lines that are the way I want them and one field line that is broken. $\endgroup$
    – DrSvanHay
    Commented Feb 27, 2022 at 9:05

Your Answer

By clicking “Post Your Answer”, you agree to our terms of service and acknowledge you have read our privacy policy.

Not the answer you're looking for? Browse other questions tagged or ask your own question.