2
$\begingroup$

StreamPlot of a sinusoidal wind velocity field

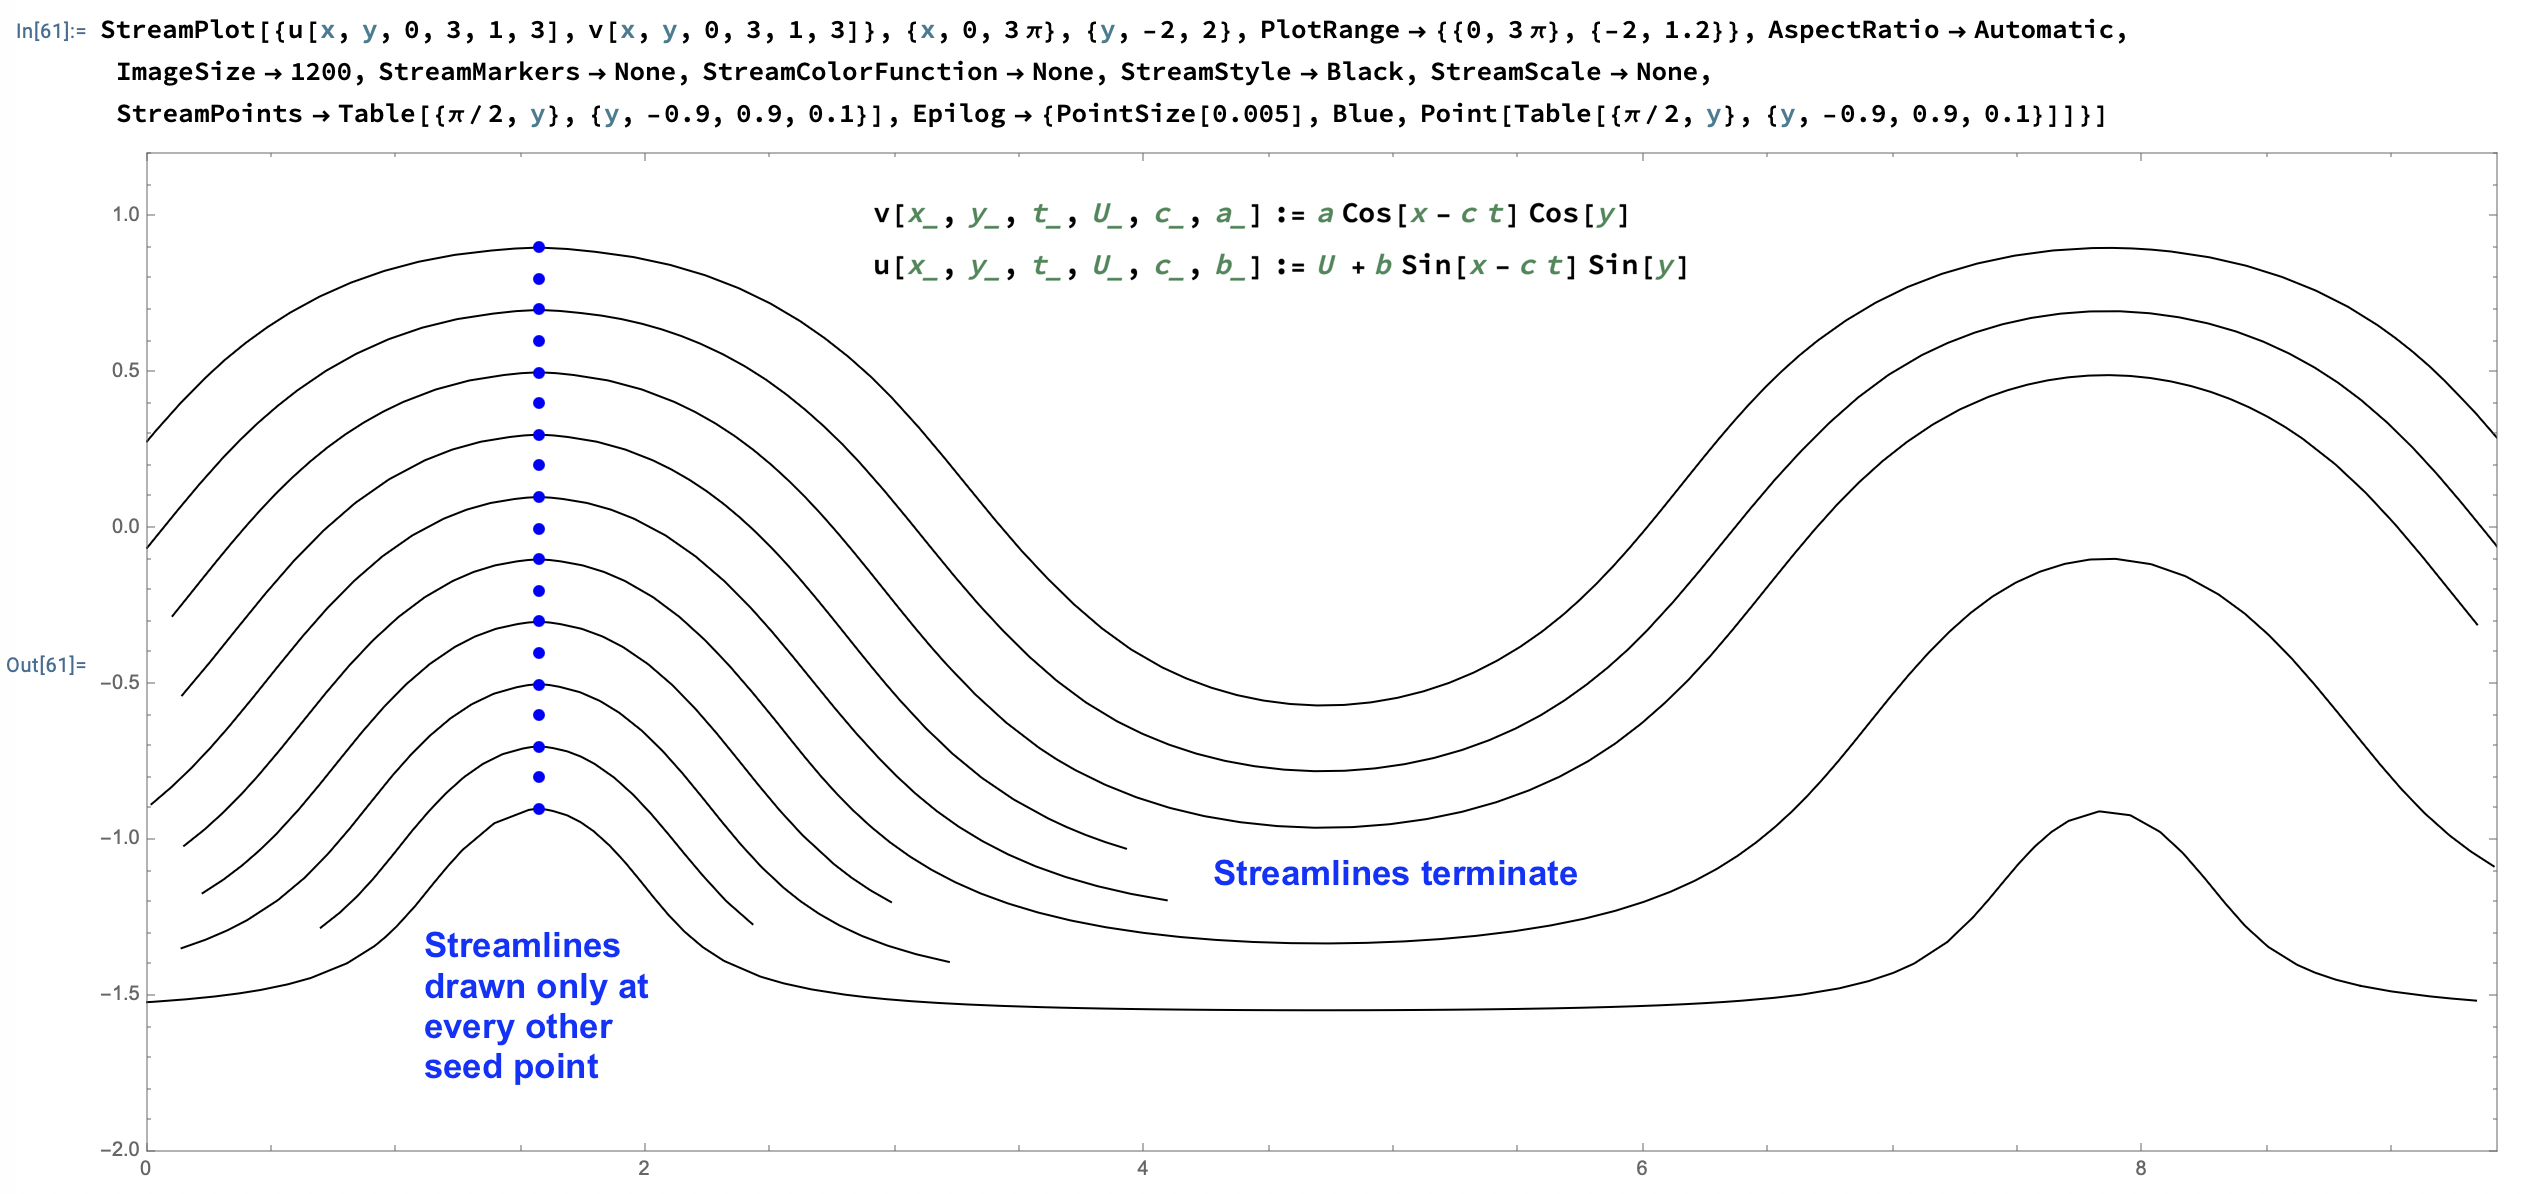
I would like to have a set of streamlines that go through my seed points and continue without ending or breaking. But, as shown here, I get streamlines at only half my seed points, and some of those terminate. Anyone know what is causing this and how to fix it?

v[x_, y_, t_, U_, c_, a_] := a Cos[x - c t] Cos[y]
u[x_, y_, t_, U_, c_, b_] := U + b Sin[x - c t] Sin[y]

StreamPlot[{u[x, y, 0, 3, 1, 3], v[x, y, 0, 3, 1, 3]}, {x, 0, 3 π}, 
 {y, -2, 2}, PlotRange -> {{0, 3 π}, {-2, 1.2}}, 
 AspectRatio -> Automatic, ImageSize -> 1200, StreamMarkers -> None, 
 StreamColorFunction -> None, StreamStyle -> Black, 
 StreamScale -> None, 
 StreamPoints -> Table[{π/2, y}, {y, -0.9, 0.9, 0.1}], 
 Epilog -> {PointSize[0.005], Blue, 
   Point[Table[{π/2, y}, {y, -0.9, 0.9, 0.1}]]}]
$\endgroup$
2

1 Answer 1

5
$\begingroup$

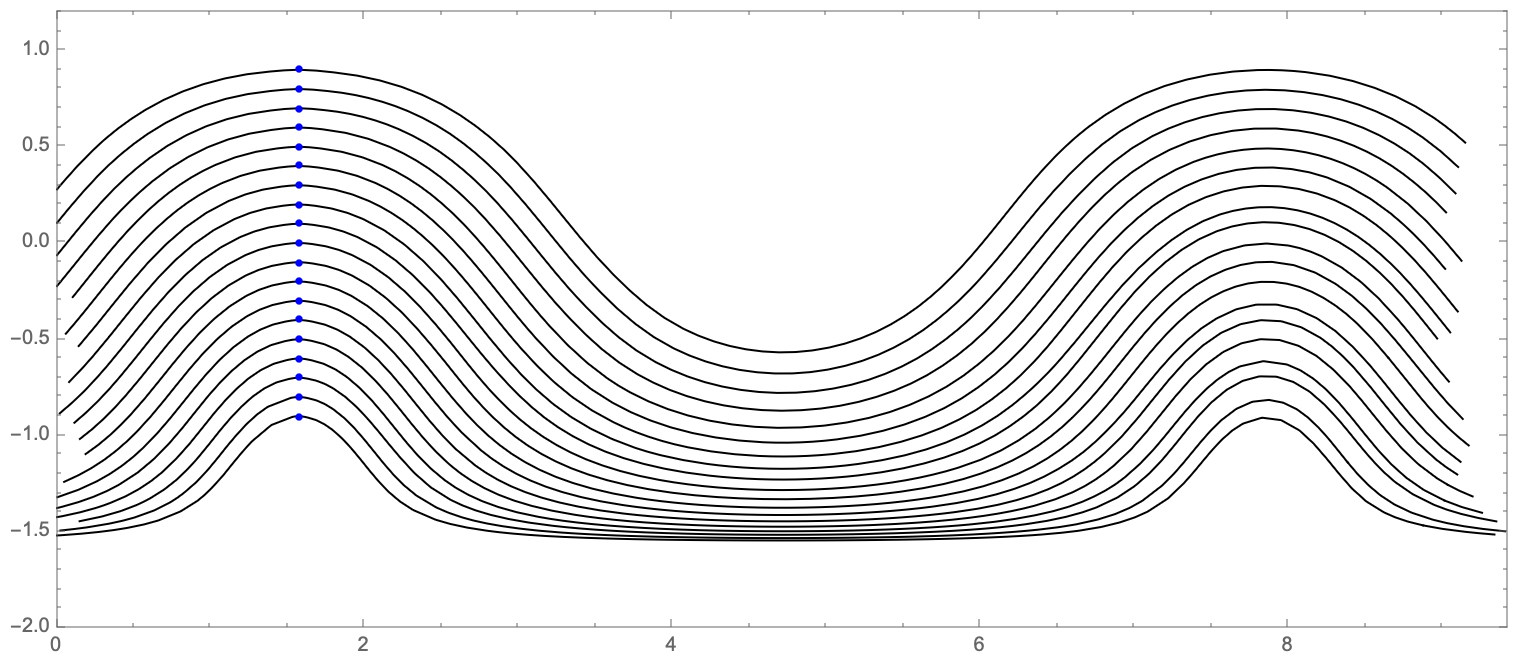
Just to simply, I pulled your Table[] function outside of the StreamPlot[], e.g.,

streampoints = Table[{\[Pi]/2, y}, {y, -0.9, 0.9, 0.1}]

and set StreamPoints more comprehensively with scaling.

v[x_, y_, t_, U_, c_, a_] := a  Cos[x - c  t]  Cos[y]
u[x_, y_, t_, U_, c_, b_] := U + b  Sin[x - c  t]  Sin[y]

streampoints = Table[{\[Pi]/2, y}, {y, -0.9, 0.9, 0.1}];

StreamPlot[
 {u[x, y, 0, 3, 1, 3], v[x, y, 0, 3, 1, 3]}, {x, 0, 3  \[Pi]}, {y, -2,
   2},
 PlotRange -> {{0, 3  \[Pi]}, {-2, 1.2}},
 AspectRatio -> Automatic,
 ImageSize -> 750,
 StreamMarkers -> None,
 StreamColorFunction -> None,
 StreamStyle -> Black,
 StreamScale -> None,
 StreamPoints -> {streampoints, Automatic, Scaled[1]},
 Epilog -> {PointSize[0.005], Blue, Point[streampoints]}
 ]

enter image description here

$\endgroup$
0

Not the answer you're looking for? Browse other questions tagged or ask your own question.