7
$\begingroup$

I am trying to bound the plotting region inside a StreamPlot using RegionFunctionwith a piecewise equation. Here's the code:

mm = 2;
(*Boundary on state space*)
f1 = Sqrt[-2 *x1 - x1^2];
f2 = -Sqrt[2 *x1 - x1^2];
x2f = Piecewise[{{f1, x1 <= 0}, {f2, x1 > 0}}];
x2ff = Function[x1, Evaluate@x2f];
plot1 = Plot[x2ff[x1], {x1, -mm, mm}];

(*Dynamical system*)
A = {{0, 1}, {-1, 0}};
b = {{0}, {1}};
eqdyn = Flatten[A . {{x1}, {x2}} + b];

StreamPlot[eqdyn, {x1, -mm, mm}, {x2, -mm, mm},
 RegionFunction -> Function[{x1, x2}, x2 < x2ff[x1]]]

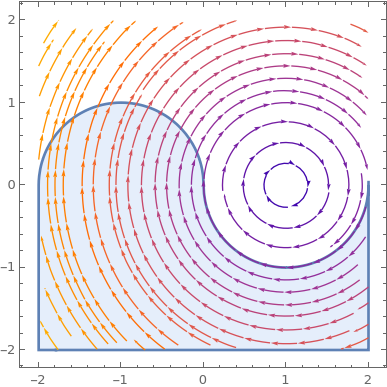
StreamPlot Output

The bounded region is correctly highlighted in the plot, but it's not respected. If i change f1 and f2 with something else it works as intended, like:

mm = 2;
(*Boundary on state space*)
f1 = x1;
f2 = -x1;

... rest of the code ...

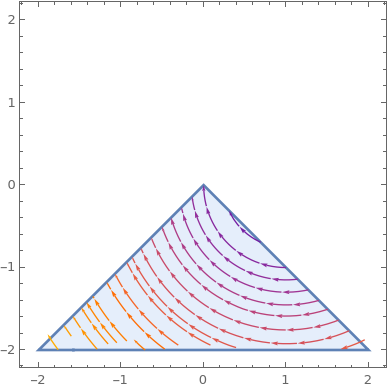
StreamPlot Output

$\endgroup$
3
  • $\begingroup$ When I run your code, I get a "Less::nord: Invalid comparison with 0. +0.426173 I attempted." error. $\endgroup$
    – march
    Commented Jun 12 at 19:52
  • $\begingroup$ @march what's your Mathematica version? $\endgroup$
    – zurg
    Commented Jun 12 at 20:05
  • $\begingroup$ "12.0.0 for Mac OS X x86 (64-bit) (April 7, 2019)" $\endgroup$
    – march
    Commented Jun 12 at 23:24

3 Answers 3

7
$\begingroup$

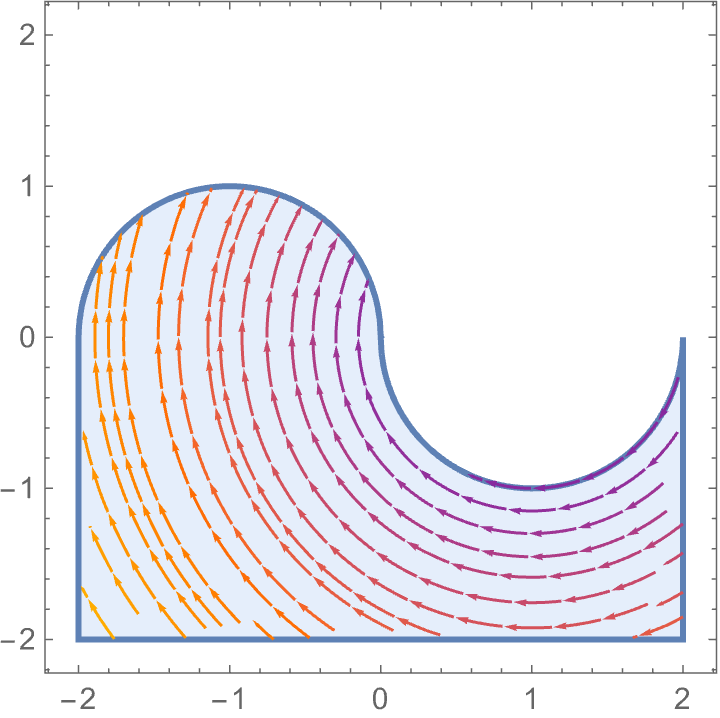
I guess complex values confuse StreamPlot/RegionFunction. Try this:

mm = 2;
(*Boundary on state space*)
f1 = Sqrt[-2*x1 - x1^2];
f2 = -Sqrt[2*x1 - x1^2];
x2f = Piecewise[{
  {f1, -2*x1 - x1^2 >= 0 && x1 <= 0},
  {f2,  2*x1 - x1^2 >= 0 && x1 >  0}}];
x2ff = Function[x1, Evaluate@x2f];
plot1 = Plot[x2ff[x1], {x1, -mm, mm}];

(*Dynamical system*)
A = {{0, 1}, {-1, 0}};
b = {{0}, {1}};
eqdyn = Flatten[A . {{x1}, {x2}} + b];

StreamPlot[eqdyn, {x1, -mm, mm}, {x2, -mm, mm}, 
 RegionFunction -> Function[{x1, x2}, x2 < x2ff[x1]]]

enter image description here

$\endgroup$
5
$\begingroup$

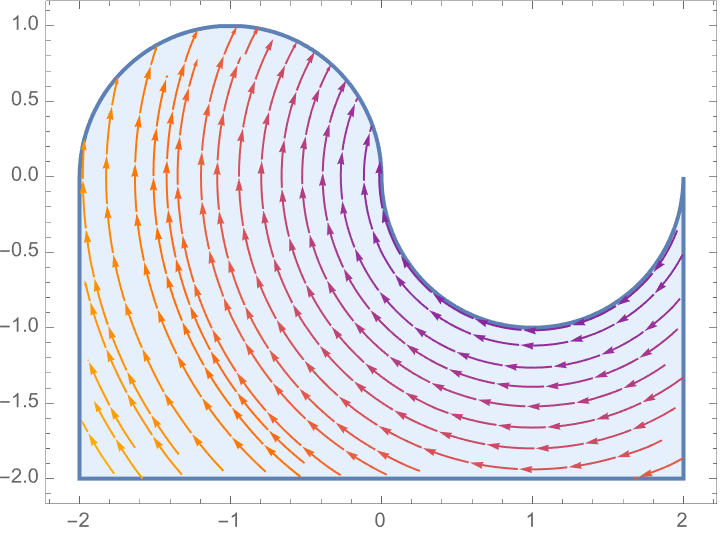
This doesn't answer why RegionFunction isn't working, but as a work around you can use an explicit region instead of RegionFunction:

reg = ImplicitRegion[x2 < x2ff[x1], {{x1, -mm, mm}, {x2, -mm, mm}}];
StreamPlot[eqdyn, {x1, x2} \[Element] reg, AspectRatio -> Automatic]

enter image description here

The problem with RegionFunction could be a bug, worth mentioning to Wolfram support.

$\endgroup$
3
$\begingroup$

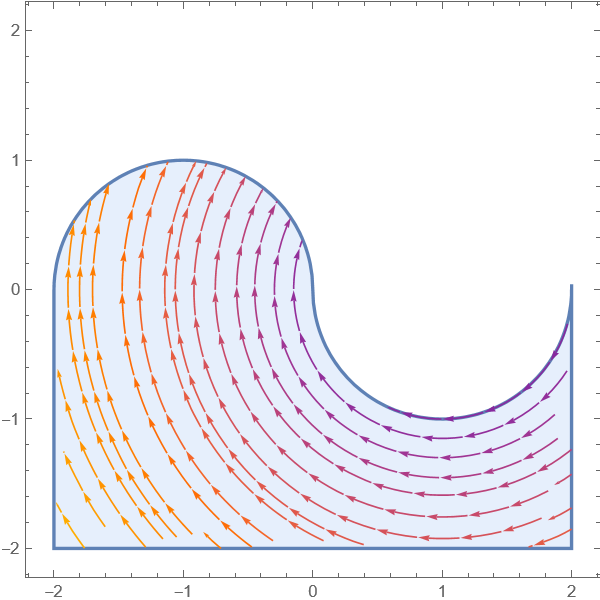
RegionMember can be helpful.

Using the given:

A = {{0, 1}, {-1, 0}};
b = {{0}, {1}};
eqdyn = Flatten[A . {{x1}, {x2}} + b];

Defining the region and the region member function and plotting:

reg = RegionDifference[
  RegionUnion[Disk[{-1, 0}, 1, {0, Pi}], Rectangle[{-2, -2}, {2, 0}]],
   Disk[{1, 0}, 1, {Pi, 2 Pi}]]
rm = RegionMember[reg]

StreamPlot[eqdyn, {x1, -2, 2}, {x2, -2, 2}, 
 RegionFunction -> Function[{x, y}, rm[{x, y}]]]

enter image description here

$\endgroup$

Your Answer

By clicking “Post Your Answer”, you agree to our terms of service and acknowledge you have read our privacy policy.

Not the answer you're looking for? Browse other questions tagged or ask your own question.