1
$\begingroup$

I used this code to solve an equation and now I would like to plot the solution with its inverse. I can't get some figures?!!

Clear["Global`*"]
eqns = {Derivative[1][y][
 x] + (3/2)*(a - b)*(y[x]/x) - ((3/2)*a - 1)*(1/(y[x]*x^3)) == 0}
 sol = FullSimplify[DSolve[eqns, y[x], x]]
 y2[x_] = y[x] /. sol[[2]];
 DSolve[{y2[x[t]] == Derivative[1][x][t]/x[t]}, x[t], t]
 a = 1.3; b = 0.7; Plot[(
 2 Hypergeometric2F1[1/2, (3 (a - b))/(-4 + 6 a - 6 b), (
 4 - 9 a + 9 b)/(4 - 6 a + 6 b), ((2 - 3 a) #1^(-2 + 3 a - 3 b))/((-2 + 3 a - 3 b) C[
 1])] Sqrt[1 + ((-2 + 3 a) #1^(-2 + 3 a - 3 b))/((-2 + 3 a - 3 b) C[1])])/(
 3 (a - b) Sqrt[(-2 + 3 a)/#1^2 + (-2 + 3 a - 3 b) C[
 1] #1^(-3 a + 3 b)]), {#1, 1, 10}]
$\endgroup$
1
  • $\begingroup$ Comments are not for extended discussion; this conversation has been moved to chat. $\endgroup$
    – Kuba
    Commented Jan 27, 2022 at 12:06

2 Answers 2

1
$\begingroup$

Without specifying a,b, introduce an initial condition y[1]==y1 in your ode. DSolve evaluates two solutions depending on x,y1,a,b

Clear["Global`*"]
sol = FullSimplify[DSolve[{Derivative[1][y][x] + (3/2)*(a - b)*(y[x]/x) - ((3/2)*a - 1)*(1/(y[x]*x^3)) == 0, y[1] == y1}, y[x], x]]

$\left\{\left\{y(x)\to -\frac{\sqrt{x^{3 b-3 a}\left(\text{y1}^2 (3 a-3 b-2)-3 a+2\right)+\frac{3a-2}{x^2}}}{\sqrt{3 a-3 b-2}}\right\},\left\{y(x)\to\frac{\sqrt{x^{3 b-3 a} \left(\text{y1}^2 (3 a-3 b-2)-3a+2\right)+\frac{3 a-2}{x^2}}}{\sqrt{3 a-3b-2}}\right\}\right\}$

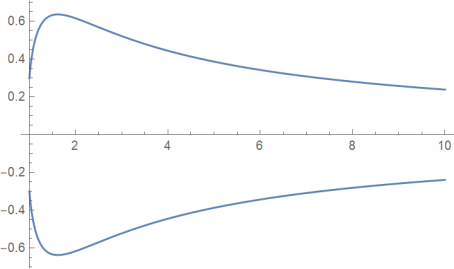
Plot special solution

Plot[y[x] /. sol /. {y1 -> 3/10, a -> 13/10, b -> 7/10}, {x, 1, 10}]

enter image description here

The plot shows that the InverseFunction exists only piecewise!

addendum

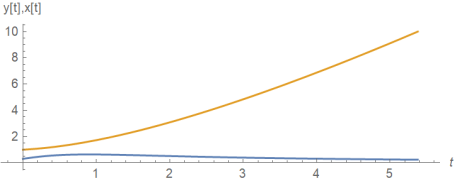
Second ode seems symbolically not easily solvable. Therefore numerical solution is appropriate. The second ode is transformed to t'[x]==1/(x y[x]), now it's possible to solve the two odes for t[x],y[x] in one step:

ty = ParametricNDSolveValue[{Derivative[1][y][x] + (3/2)*(a - b)*(y[x]/x) - ((3/2)*a - 1)*(1/(y[x]*x^3)) ==      0, y[1] == y1, t'[x] == 1/(x y[x]), t[1] == 0} /. {y1 -> 3/10, a -> 13/10, b -> 7/10}, {t, y}, {x, 1, 10}, y1]  

ParametricPlot[{{ty[1][[1]][x], ty[1][[2]][x]}, {ty[1][[1]][x] , x}}, {x, 1, 10}, AxesLabel -> {t, "y[t],x[t]"},AspectRatio-> 1/3,PlotLegends -> {"y"[t], "x[t]"}]

enter image description here

$\endgroup$
5
  • $\begingroup$ You just plot the first part which is easy I would like to do for the second DSolve[] $\endgroup$ Commented Jan 27, 2022 at 16:08
  • $\begingroup$ Plot shows both parts of sol (but not the inverse) $\endgroup$ Commented Jan 27, 2022 at 16:24
  • $\begingroup$ As you see in my code the plots should be x[t] and y[t]. but you just plot y[x]!! $\endgroup$ Commented Jan 27, 2022 at 21:01
  • $\begingroup$ Ulrich Neumann, t'[x]==1/(x y[x]) ?????!!!!! how? I guess it is x'[t]==1/(x y[x]) $\endgroup$ Commented Jan 28, 2022 at 14:01
  • $\begingroup$ t'[x]==1/(x y[x]) is equivalent to the ode x'[t]/x[t]==y[x[t]] $\endgroup$ Commented Jan 28, 2022 at 15:07
1
$\begingroup$

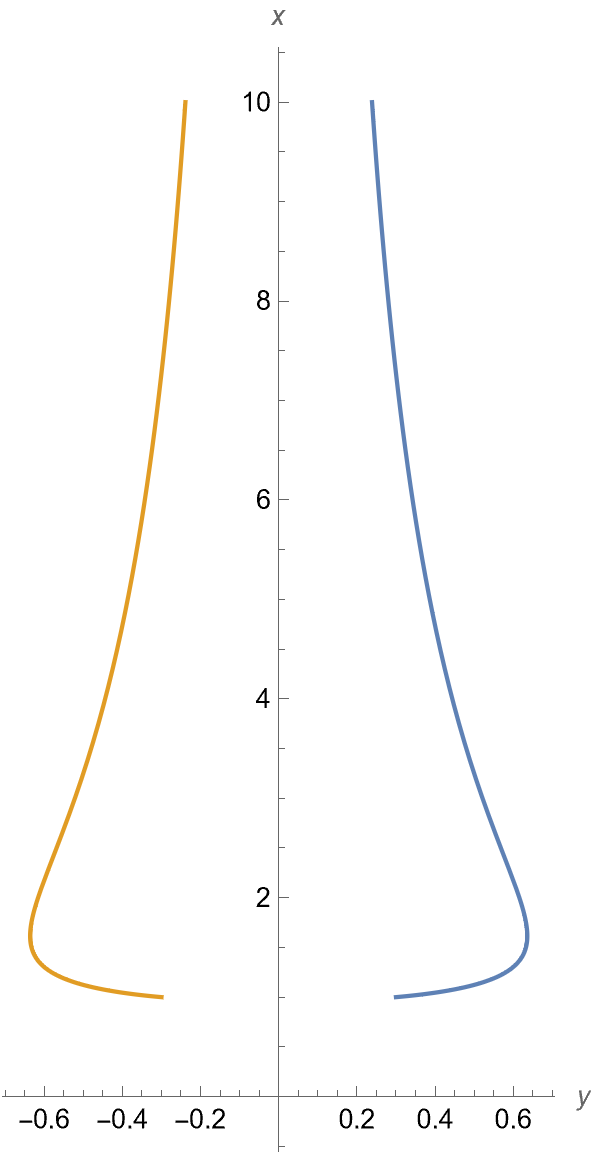
I do not believe that your second DSolve gives the inverse of y. In any case, it is easy to plot the inverse. With Ulrich Neumann's answer as a starting plot, use

ParametricPlot[{{(y[x] /. sol)[[2]] /. {y1 -> 3/10, a -> 13/10, b -> 7/10}, x},
                {(y[x] /. sol)[[1]] /. {y1 -> 3/10, a -> 13/10, b -> 7/10}, x}}, 
                {x, 1, 10}, AspectRatio -> 2, AxesLabel -> {y, x}]

enter image description here

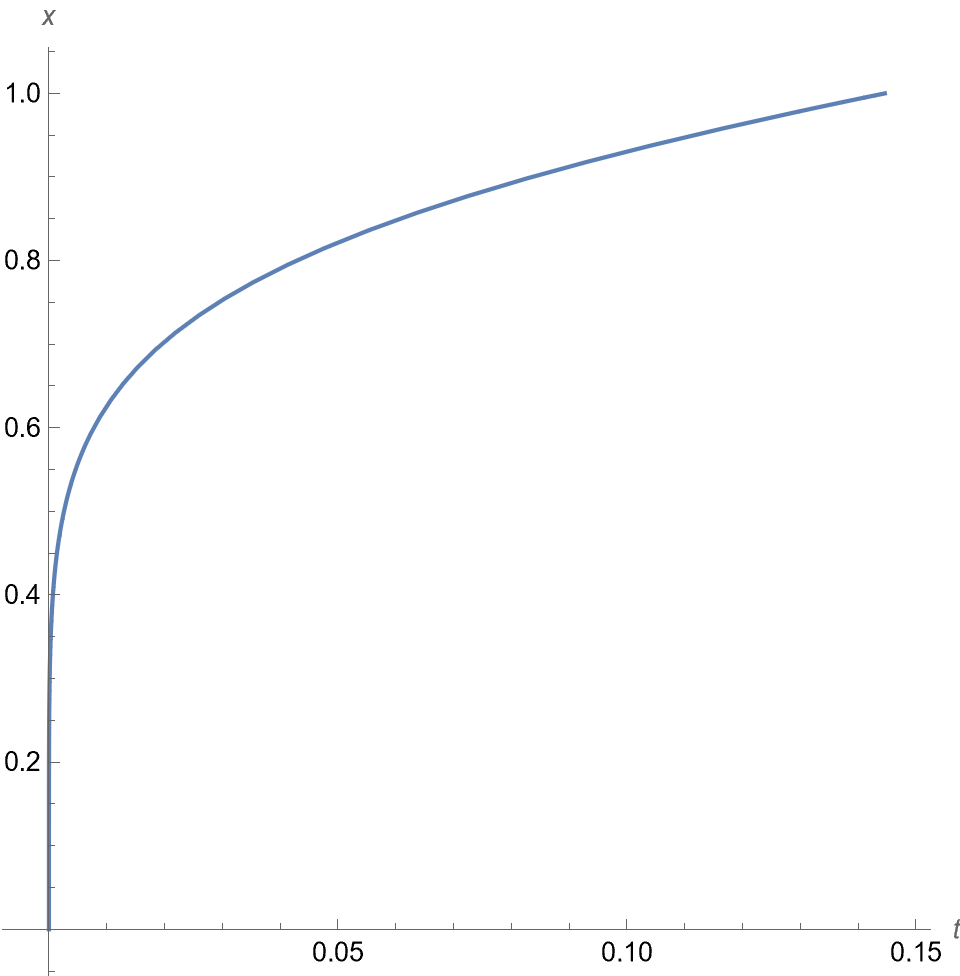
However, if you really do wish to plot the result of the second DSolve, designate it as soli and extract an equation for t as a function of x.

soli[[1, 1, 2, 1]] == soli[[1, 1, 2, 0, 1]][x]
Sqrt[10] # & /@ % /. {a -> 4, b -> 0, C[1] -> 1, C[2] -> 0}

(* t == (Sqrt[5/2] Sqrt[1 + x^10] Hypergeometric2F1[1/2, 3/5, 8/5, 
       -x^10])/(3 Sqrt[10/x^12 + 10/x^2]) *)

(I have chosen the constants for convenience. Other values also work.) Then, use ParametricPlot as before.

ParametricPlot[{%[[2]], x}, {x, 0, 1}, AspectRatio -> 1, AxesLabel -> {t, x}]

enter image description here

There are, of course, other ways to plot inverses of functions. The method shown seems simplest to me

$\endgroup$
4
  • $\begingroup$ bbgodfrey I can't see soli[[1, 1, 2, 1]] is working??!! even with sol[[1, 1, 2, 1]] bbgodfrey $\endgroup$ Commented Jan 28, 2022 at 13:43
  • $\begingroup$ @FelipeDura Sorry for the slow response. I fixed a typo in the secod ParametricPlot call $\endgroup$
    – bbgodfrey
    Commented Jan 29, 2022 at 5:21
  • $\begingroup$ bbgodfrey this code you put here it's not working $\endgroup$ Commented Mar 1, 2022 at 14:49
  • $\begingroup$ @FelipeDura I just ran the code, and it provides the curve shown in my answer. In what sense is my code not working? $\endgroup$
    – bbgodfrey
    Commented Mar 2, 2022 at 2:26

Your Answer

By clicking “Post Your Answer”, you agree to our terms of service and acknowledge you have read our privacy policy.

Not the answer you're looking for? Browse other questions tagged or ask your own question.