5
$\begingroup$

I am using ListDensityPlot with RegionFunction (MMA12.3 on Win 64) but it takes too long

region = Polygon[{{-(\[Pi]/3), -(\[Pi]/Sqrt[3])}, {-((2 \[Pi])/3), 
     0}, {-(\[Pi]/3), \[Pi]/Sqrt[3]}, {\[Pi]/3, \[Pi]/
      Sqrt[3]}, {(2 \[Pi])/3, 
     0}, {\[Pi]/3, -(\[Pi]/Sqrt[3])}, {\[Pi]/
      3, -(\[Pi]/Sqrt[3])}, {-(\[Pi]/3), -(\[Pi]/Sqrt[3])}}];
datr = Flatten[
   ParallelTable[{x, y, Cos[x] Sin[x y]}, {x, -2.5, 2.5, 
     0.05}, {y, -2.5, 2.5, 0.05}], 1];

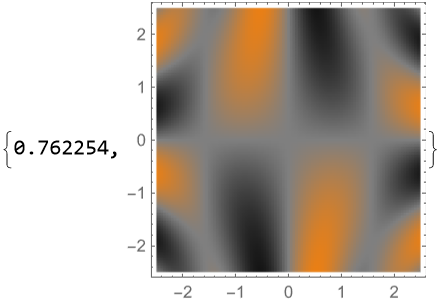
here is the result without RegionFunction

ListDensityPlot[datr, 
  ColorFunction -> (Blend[{Orange, Gray, Black}, 
      Rescale[#, {-1, 1}]] &), InterpolationOrder -> 0, 
  ColorFunctionScaling -> False, 
  ClippingStyle -> Automatic] // AbsoluteTiming    

enter image description here

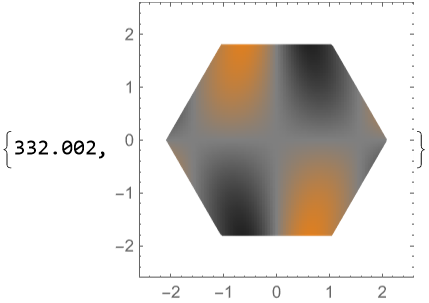
and with

ListDensityPlot[datr, 
  ColorFunction -> (Blend[{Orange, Gray, Black}, 
      Rescale[#, {-1, 1}]] &), InterpolationOrder -> 0, 
  ColorFunctionScaling -> False, ClippingStyle -> Automatic, 
  RegionFunction -> 
   Function[{x, y}, {x, y} \[Element] region]] // AbsoluteTiming    

enter image description here

$\endgroup$

2 Answers 2

5
$\begingroup$

I dont know why it takes so long. But I have a solution for you. Its sort of a hack

AbsoluteTiming[Show[ListDensityPlot[datr, ColorFunction -> 
          (Blend[{Orange, Gray, Black}, Rescale[#1, {-1, 1}]] & ), 
   InterpolationOrder -> 0, ColorFunctionScaling -> False, 
         ClippingStyle -> Automatic], 
    Graphics[{White, Polygon[{{-2.5, -2.5}, {-2.5, 2.5}, {2.5,2.5}, {2.5, -2.5}} -> 
    {{-(Pi/3), -(Pi/Sqrt[3])}, {-((2*Pi)/3), 0}, {-(Pi/3), 
    Pi/Sqrt[3]}, {Pi/3, Pi/Sqrt[3]}, {(2*Pi)/3, 0}, 
    {Pi/3, -(Pi/Sqrt[3])}, {Pi/3, -(Pi/Sqrt[3])}, {-(Pi/3), -(Pi/Sqrt[3])}}]}]]]

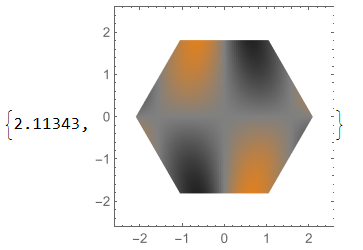
enter image description here

This code takes far less time.On my machine it takes 2.11343 seconds.

I basically make a rectangular polygon with a hole in it.This hole is the polygon specified in your region variable.Then I use Show command to overlay the image and the polygon with the hole.

Check out the documentation for Polygon: https://reference.wolfram.com/language/ref/Polygon.html

enter image description here

$\endgroup$
5
$\begingroup$

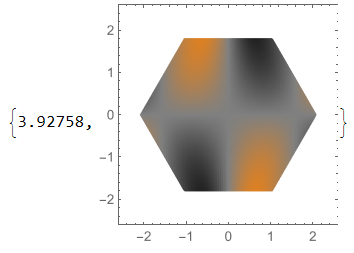
Use pre-computed RegionMemberFunction:

Module[{rf = RegionMember[region]},
  ListDensityPlot[datr, 
   ColorFunction -> (Blend[{Orange, Gray, Black}, Rescale[#, {-1, 1}]] &), 
   InterpolationOrder -> 0, ColorFunctionScaling -> False, ClippingStyle -> Automatic, 
   RegionFunction -> (rf[{#1, #2}] &)]] // AbsoluteTiming

output

$\endgroup$

Your Answer

By clicking “Post Your Answer”, you agree to our terms of service and acknowledge you have read our privacy policy.

Not the answer you're looking for? Browse other questions tagged or ask your own question.