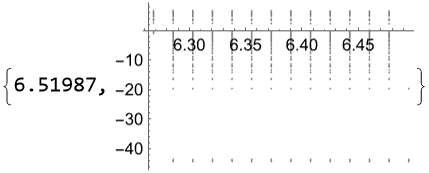
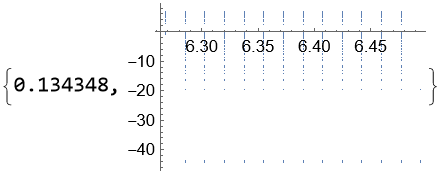
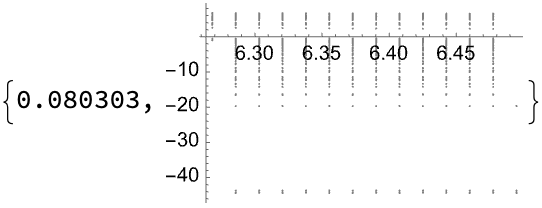
I have about 200000 points, using ListPlot with ColorFunction takes too long. Here is a minimal example with 5000 points which takes 7 sec.
dataA = Get[
   "https://www.dropbox.com/s/kf9ojjoe9na0rft/data.dat?dl=1"];
this is a custom color
colF[arg_] := Blend[{Gray, Blue}, Rescale[arg, {0, 1}]]
and visualizing the data as
ListPlot[dataA[[All, 1 ;; 2]], ColorFunctionScaling -> False,
  ColorFunction ->
   Function[{x, y},
    colF[dataA[[Position[dataA[[All, 1]], x][[1, 1]],
       3]]]]] // AbsoluteTiming
However, without coloring, it takes 0.1 sec
ListPlot[dataA[[All, 1 ;; 2]]] // AbsoluteTiming


Positionfor every point in the list. This causes $O(n^2)$ time complexity for the plot, where $n$ is the length of the list. There are multiple options which you could employ, but one I'd suggest would be ditchingColorFunctionand usingStyleon each item, which should, if I understand your code correctly, avoid the need forPosition. $\endgroup$ListPlot[Style[{#1, #2}, colF[#3]] & @@@ dataA]should accomplish the same task as your code withColorFunction, but interestingly there seems to be a scalability issue in styledListPlot. I'll probably write a bug report on this... $\endgroup$ColorFunctionis actually a lot more efficient thatStyle. So, my advice is actually not that great (apart from getting rid of repeatedPositioncalls). $\endgroup$