1
$\begingroup$

I'm triying to plot the following matrix:

a = Pi/6;
g := 2.4(*eV A*);
kD := 0.026 (*A^-1*);
D0 := -0.592(*eV*);
R := 10(*A*);
L = 3 (*A*);

f1[x_, l_] := 
  BesselJ[(l*Pi)/a + 1, x] BesselJ[(l*Pi)/a, x];

l1 = NSolve[f1[x, l] == 0 && 0 <= x < 100 /. l -> 1, x, Reals];
zl1 = Table[{x /. l1[[i]], 0}, {i, 1, Length[l1]}];

zzl1 = Table[x /. l1[[i]], {i, 1, Length[l1]}];
El1[n_, m_] := 
  Sqrt[(D0/2)^2 + ((g*zzl1[[n]])/
    R)^2 + ((g*Pi*m)/L)^2];

A[n_, m_] := 
  Sqrt[4/(a L)]*\[Sqrt]((1 + g^2/(D0/2 + 
            El1[n, m])^2*(Pi^2 m^2)/L^2)*R^2/
       2 (BesselJ[Pi/a, zzl1[[n]]]^2 - 
         BesselJ[Pi/a + 1, 
           zzl1[[n]]] BesselJ[Pi/a - 1, 
           zzl1[[n]]]) + g^2/(D0/2 + 
         El1[n, m])^2*zzl1[[n]]^2/
       2 (BesselJ[Pi/a + 1, zzl1[[n]]]^2 - 
         BesselJ[Pi/a + 2, 
           zzl1[[n]]] BesselJ[Pi/a, zzl1[[n]]]));

d[n_, m_] := 
  A[1, 1] Conjugate[A[n, m]] Integrate[
    z Sin[Pi/L z] Sin[(m Pi)/L z], {z, 0, L}] Integrate[
    Sin[Pi/a y] Sin[Pi/a y], {y, 
     0, a}] ((1 + g^2/((D0/2 + 
            El1[1, 1]) (D0/2 + 
            El1[n, m]))*(Pi^2 m*1)/L^2) Integrate[
       r BesselJ[Pi/a, 
         zzl1[[1]]/R r] BesselJ[Pi/a, zzl1[[n]]/R r], {r, 0,
         R}] + (g^2 Sqrt[zzl1[[1]] zzl1[[n]]]/
        R^2)/((D0/2 + El1[1, 1]) (D0/2 + 
         El1[n, m]))*
      Integrate[
       r BesselJ[Pi/a + 1, 
         zzl1[[1]]/R r] BesselJ[Pi/a + 1, 
         zzl1[[n]]/R r], {r, 0, R}]);

T = ParallelTable[Abs[d[n, m]]^2/
   Abs[d[1, 1]]^2, {n, 1, 10}, {m, 1, 10}];

MatrixPlot[T, PlotLegends -> Automatic, ColorFunctionScaling -> True, 
 ColorFunction -> "AvocadoColors", Mesh -> All, 
 MeshStyle -> Directive[Gray, Dashed], ImageSize -> {600, 600}, 
 AspectRatio -> 1, Frame -> True, 
 FrameStyle -> Directive[Black, Thick, 23]]

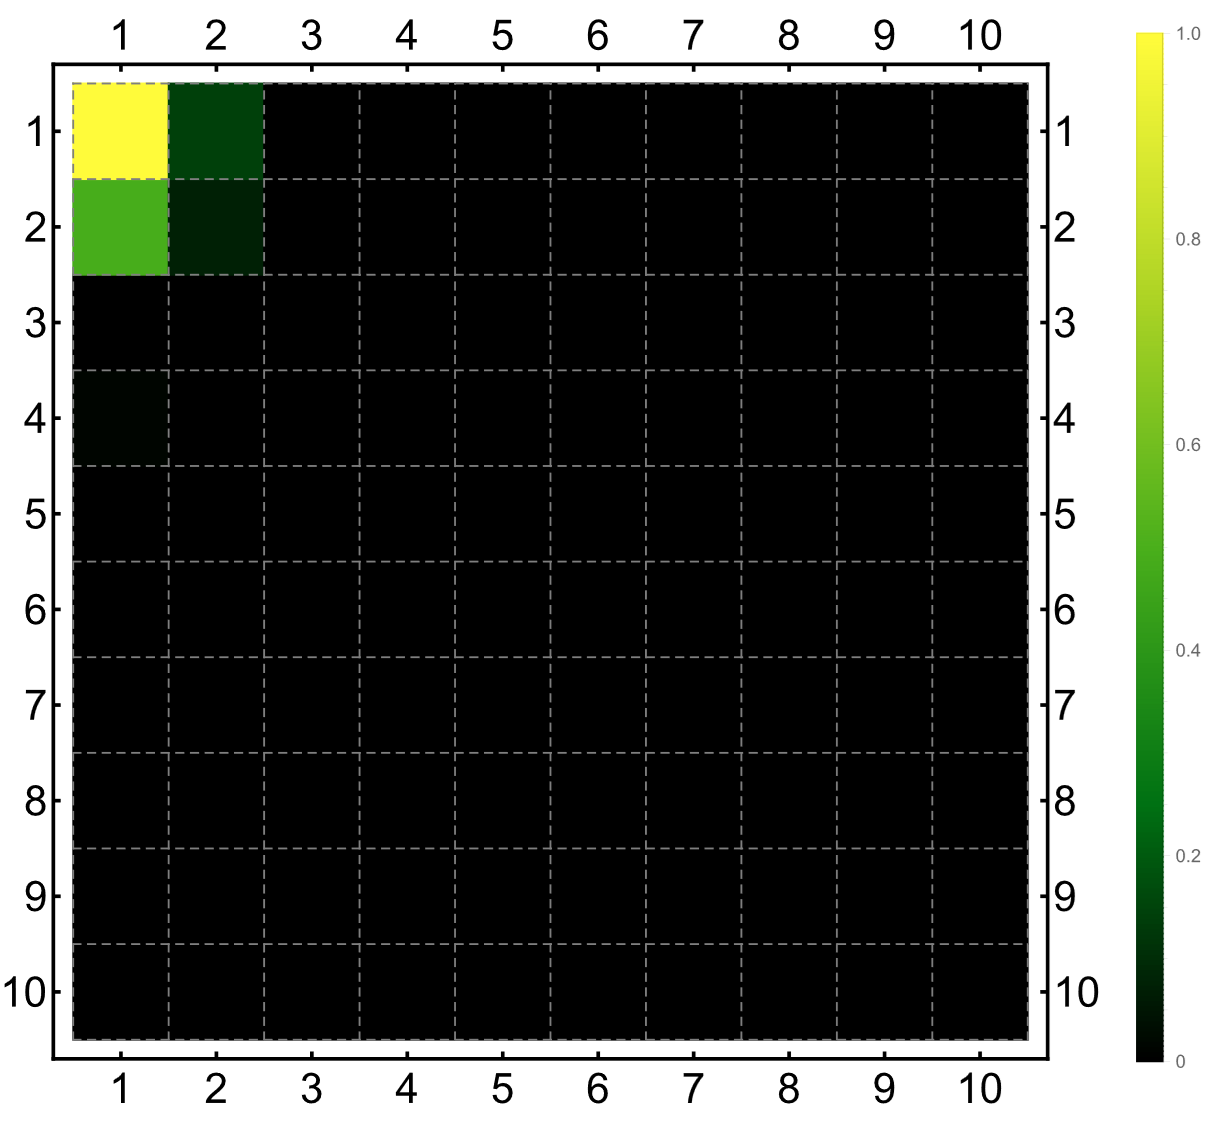
The result is the following: Result of matrix T

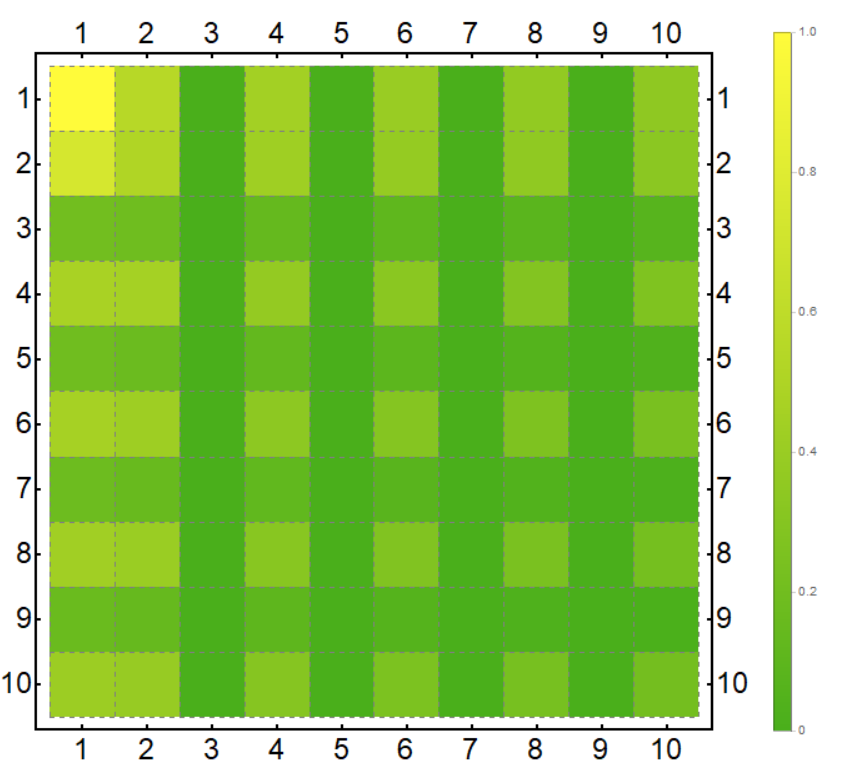
Now, I want a color code as:

BarLegend[{"AvocadoColors", {0, 1}}, LegendMarkerSize -> 400, 
 LegendMargins -> {{0, 0}, {0, 0}}, LegendMarkers -> "Square", 
 LabelStyle -> {Black, FontFamily -> "Times", FontSize -> 15}]

Bar i wish

Do you know how I can get it?

Thanks.
$\endgroup$
2
  • $\begingroup$ It looks like the entries of my matrix are very small. The bar that I whis is given by ColorFunctionScaling -> False in the instructions of MatrixPlot. $\endgroup$ Commented Dec 30, 2021 at 2:59
  • $\begingroup$ "With the default setting ColorFunctionScaling -> True, scaling is done based on a mixture of relative value and ranking for each matrix element. The final scaled value always lies between 0 and 1, with scaled value 0.5 corresponding to matrix element value 0." Your data is in the interval {0, 1}, consequently, it only uses half of the color gradient's range. With the scaling set to False most of your data is effectively zero. $\endgroup$
    – Bob Hanlon
    Commented Dec 30, 2021 at 14:53

2 Answers 2

2
$\begingroup$

The values of the elements in your matrix T are significant for three elements, and the rest of all are close to zero. However, In your figure where colorfunction scaling is true, T(1,2) and T(1,4) are nearly of the same color which shouldn't be the case as T(1,4) is close to to zero. For a threshold of 10^-3 the matrix elements are as

T={{1.,      0.141737, 0., 0., 0., 0., 0., 0., 0., 0.},
  {0.492966, 0.071704, 0., 0., 0., 0., 0., 0., 0., 0.},
  {0.,       0.,       0., 0., 0., 0., 0., 0., 0., 0.},
  {0.0124827,0.001935, 0., 0., 0., 0., 0., 0., 0., 0.},
  {0.,       0.,       0., 0., 0., 0., 0., 0., 0., 0.},
  {0.0021716,0.,       0., 0., 0., 0., 0., 0., 0., 0.},
  {0.,       0.,       0., 0., 0., 0., 0., 0., 0., 0.},
  {0.,       0.,       0., 0., 0., 0., 0., 0., 0., 0.},
  {0.,       0.,       0., 0., 0., 0., 0., 0., 0., 0.},
  {0.,       0.,       0., 0., 0., 0., 0., 0., 0., 0.}}

For your choice of barlegend, I believe the plot should reflect the same which top 3 elements by green colors and rest all black.

MatrixPlot[T, PlotRange -> All, ColorFunctionScaling -> False,ColorFunction -> "AvocadoColors", PlotLegends -> BarLegend[{"AvocadoColors", {0, 1}},LegendMarkerSize -> 400, LegendMargins -> {{0, 0}, {0, 0}}, LegendMarkers -> "Square",  LabelStyle -> {Black, FontFamily -> "Times", FontSize -> 15}],Mesh -> All, MeshStyle -> Directive[Gray, Dashed],  ImageSize -> {600, 600}, AspectRatio -> 1, Frame -> True, FrameStyle -> Directive[Black, Thick, 23]]

enter image description here

$\endgroup$
0
$\begingroup$

It looks like the entries of my matrix are very small. The bar that I whis is given by ColorFunctionScaling -> False in the instructions of MatrixPlot.

$\endgroup$

Your Answer

By clicking “Post Your Answer”, you agree to our terms of service and acknowledge you have read our privacy policy.

Not the answer you're looking for? Browse other questions tagged or ask your own question.