2
$\begingroup$

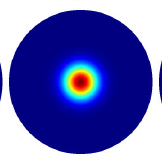
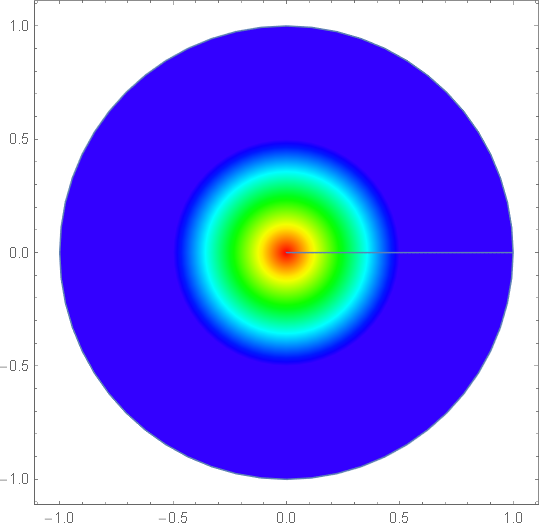
Can I approximating the following Tex style color function with Hue function(or other functions):

enter image description here

I tried to use Hue:

ParametricPlot[
 r {Cos[\[Theta]], Sin[\[Theta]]}, {\[Theta], 0, 2 \[Pi]}, {r, 0, 1},
 ColorFunction -> 
  Function[{x, y, \[Theta], r}, Hue@Max[(1 - 2 r), 0]], Axes -> None]

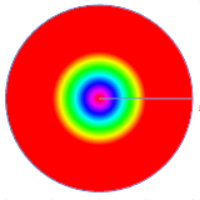
But result is not what I want, notice that the color in the center is same as the outer ring:

enter image description here

This is because the color of Hue[0] is same as Hue[1]. This cause some problems to me, because I have some function value changed from 0 to 1 smoothly, I don't want same color in both side.

$\endgroup$
1
  • $\begingroup$ The TeX colorfunction looks a lot like the Matlab default 'Jet', which is implemented in the accepted answer here $\endgroup$
    – N.J.Evans
    Commented Jul 19, 2021 at 13:28

2 Answers 2

3
$\begingroup$

Hue uses the HSB color space which is a cylindrical transformation of the RGB color space. Like you say, this means that Hue[0] and Hue[1] are both red, which is why you get the same colors in the center and outer ring. You'll want to change your ColorFunction to go from about Hue[0.7] for blue in the outer ring to Hue[0] in the inner ring.

You can do Table[Hue[h], {h, 0, 1, .05}] to get an idea of the color space.

enter image description here

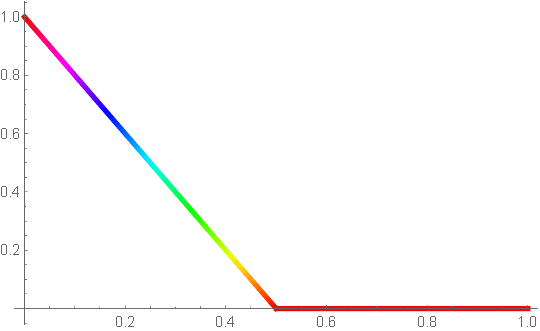
The current ColorFunction you're using looks like

Plot[Max[(1 - 2 r), 0], {r, 0, 1}, ColorFunction -> Function[r, Hue[Max[(1 - 2 r), 0]]], PlotStyle -> Thickness[0.01]] 

Yours

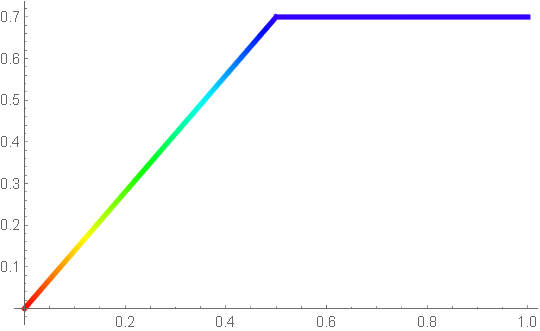
so the outer ring is Hue[0] which is red. You want something instead like

Plot[Piecewise[{{2 (r - .3 r), r < .5}, {.7, r >= .5}}], {r, 0, 1}, ColorFunction -> Function[r, Hue[Piecewise[{{2 (r - .3 r), r < .5}, {.7, r >= .5}}]]], PlotStyle -> Thickness[0.01]]

so the outer ring is Hue[0.7].

enter image description here

or in your code

ParametricPlot[r {Cos[\[Theta]], Sin[\[Theta]]}, {\[Theta], 0, 2 \[Pi]},{r, 0, 1}, ColorFunction -> Function[{x, y, \[Theta], r}, Hue@Piecewise[{{2 (r - .3 r), r < .5}, {.7, r >= .5}}]], Axes -> None]

which gives

enter image description here

$\endgroup$
2
$\begingroup$

There are many pre-defined color gradients

ColorData["Gradients"]

(* {"AlpineColors", "Aquamarine", "ArmyColors", "AtlanticColors", \
"AuroraColors", "AvocadoColors", "BeachColors", "BlueGreenYellow", \
"BrassTones", "BrightBands", "BrownCyanTones", "CandyColors", "CherryTones", \
"CMYKColors", "CoffeeTones", "DarkBands", "DarkRainbow", "DarkTerrain", \
"DeepSeaColors", "FallColors", "FruitPunchColors", "FuchsiaTones", \
"GrayTones", "GrayYellowTones", "GreenBrownTerrain", "GreenPinkTones", \
"IslandColors", "LakeColors", "LightTemperatureMap", "LightTerrain", \
"MintColors", "NeonColors", "Pastel", "PearlColors", "PigeonTones", \
"PlumColors", "Rainbow", "RedBlueTones", "RedGreenSplit", "RoseColors", \
"RustTones", "SandyTerrain", "SiennaTones", "SolarColors", "SouthwestColors", \
"StarryNightColors", "SunsetColors", "TemperatureMap", "ThermometerColors", \
"ValentineTones", "WatermelonColors"} *)

Put some or all into a Manipulate so you can visually compare and select your preferred gradient.

Manipulate[
 ParametricPlot[r {Cos[θ], Sin[θ]},
  {θ, 0, 2 π}, {r, 0, 1},
  ColorFunction -> Function[{x, y, θ, r},
    ColorData[color]@Max[(1 - 2 r), 0]], Axes -> None],
 {{color, "TemperatureMap"},
  {"DarkRainbow", "LightTemperatureMap", "Rainbow", "TemperatureMap", 
   "ThermometerColors"},
  ControlType -> PopupMenu}]
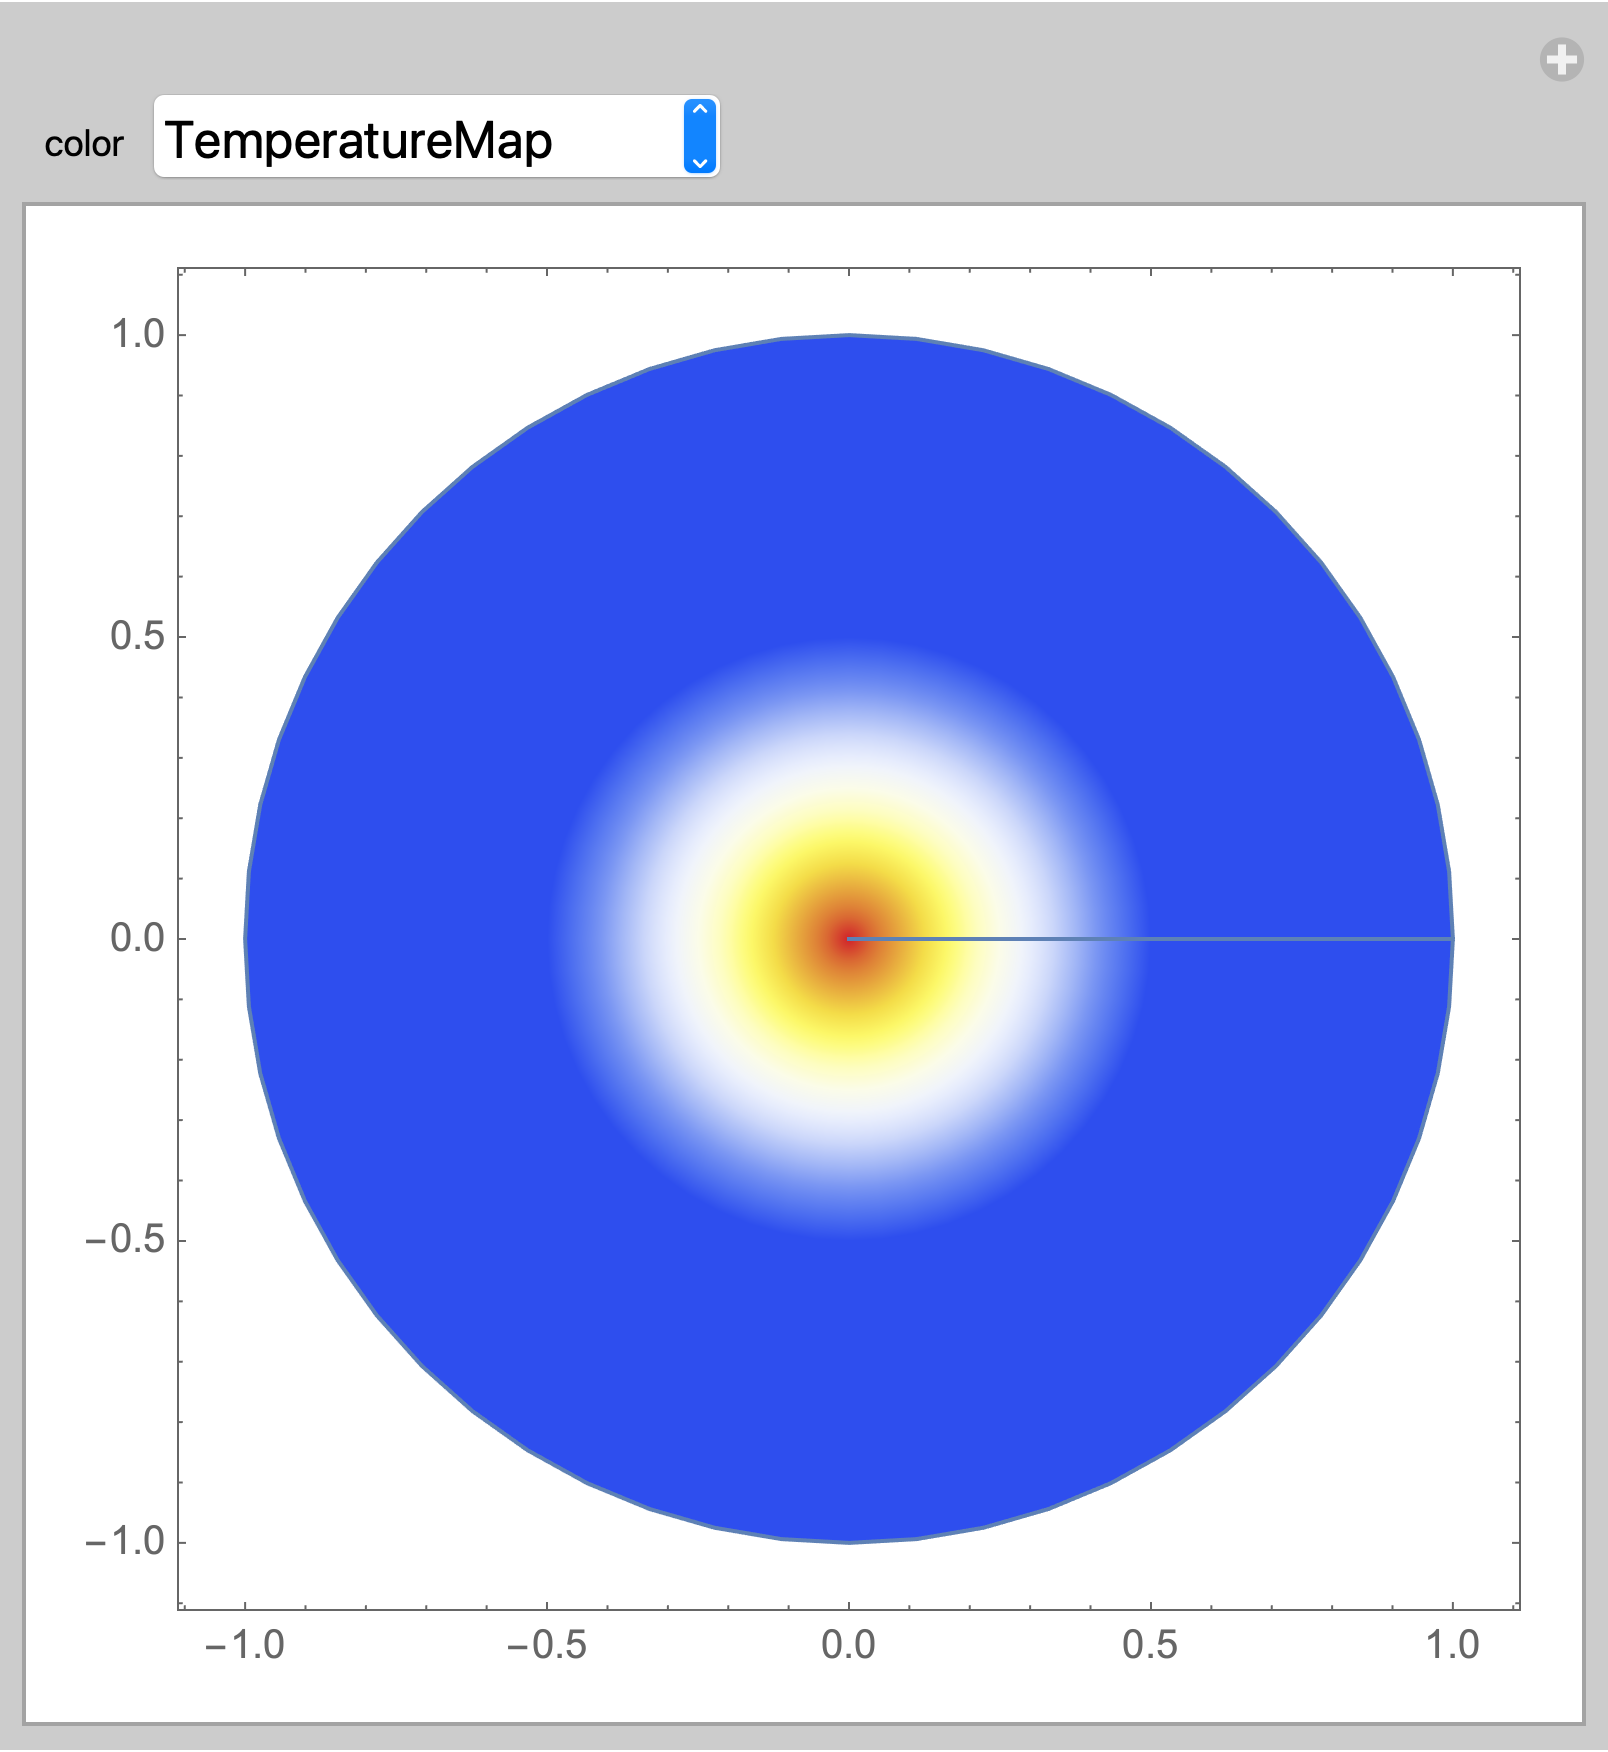
enter image description here

$\endgroup$

Your Answer

By clicking “Post Your Answer”, you agree to our terms of service and acknowledge you have read our privacy policy.

Not the answer you're looking for? Browse other questions tagged or ask your own question.