6
$\begingroup$

Suppose I plot out two sets of data on the same graph as follows:

ListPlot[{{{1, 1}, {2, 2}, {4, 4}}, {{3, 3}, {5, 5}, {6, 6}}}]

The colours of the points change based on which data set it belongs in. However, when I join the points up:

ListPlot[{{{1, 1}, {2, 2}, {4, 4}}, {{3, 3}, {5, 5}, {6, 6}}},Joined -> True]

it treats the two data sets separately and over-rides the curves. Is there a way to manipulate the colours when joining the points together such that it is treated as a single data set, but changes colour based on the set that the nearest point belongs to? I guess this may involve combining the sets in order while keeping track of which data set each point belongs to, but I'm not sure how to do this.

Thanks in advance for any help.

$\endgroup$

3 Answers 3

6
$\begingroup$

This solution splits the two data sets into multiple sets.

Each segment is coloured according to the end-point nearest the origin.

{set1, set2} = {{{1, 1}, {2, 2}, {4, 4}}, {{3, 3}, {5, 5}, {6, 6}}};

allpts = Sort@Apply[Sequence, {set1, set2}, {1}];

currentList = accumulatedLists = {};
cols = {ColorData[97, 1]};

If[MemberQ[set1, #],
    If[OddQ[Length[accumulatedLists]],
     AppendTo[currentList, #];
     AppendTo[accumulatedLists, currentList];
     AppendTo[cols, ColorData[97, 1]];
     currentList = {}];
    AppendTo[currentList, #],
    If[EvenQ[Length[accumulatedLists]],
     AppendTo[currentList, #];
     AppendTo[accumulatedLists, currentList];
     AppendTo[cols, ColorData[97, 2]];
     currentList = {}];
    AppendTo[currentList, #]] & /@ allpts;
AppendTo[accumulatedLists, currentList];

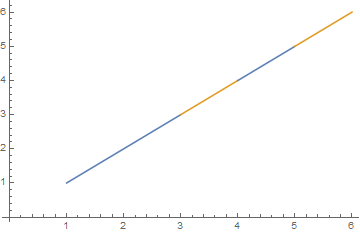
ListLinePlot[accumulatedLists, PlotStyle -> cols]

enter image description here

$\endgroup$
6
$\begingroup$
lists = {{{1, 1}, {2, 2}, {4, 4}}, {{3, 3}, {5, 5}, {6, 6}}};
{region1, region2} = Point /@ lists;
{bsf1, bsf2} = BSplineFunction /@ lists; 

ParametricPlot[{bsf1[t], bsf2[t]}, {t, 0, 1}, 
 ColorFunction ->
   (If[RegionDistance[region1][{#, #2}] < RegionDistance[region2][{#, #2}],
    ColorData[97][1], ColorData[97][2]] &), 
 ColorFunctionScaling -> False, 
 PlotStyle -> Directive[CapForm["Butt"], AbsoluteThickness[4]], 
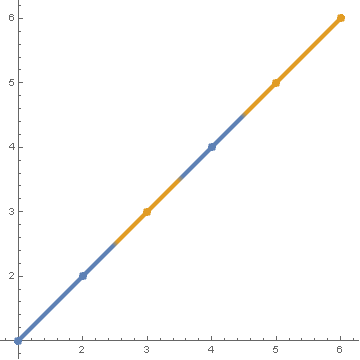
 Epilog -> First[ListPlot[lists, PlotStyle -> AbsolutePointSize[8]]]]

enter image description here

$\endgroup$
4
$\begingroup$
data = {{{1, 1}, {2, 2}, {4, 4}}, {{3, 3}, {5, 5}, {6, 6}}};

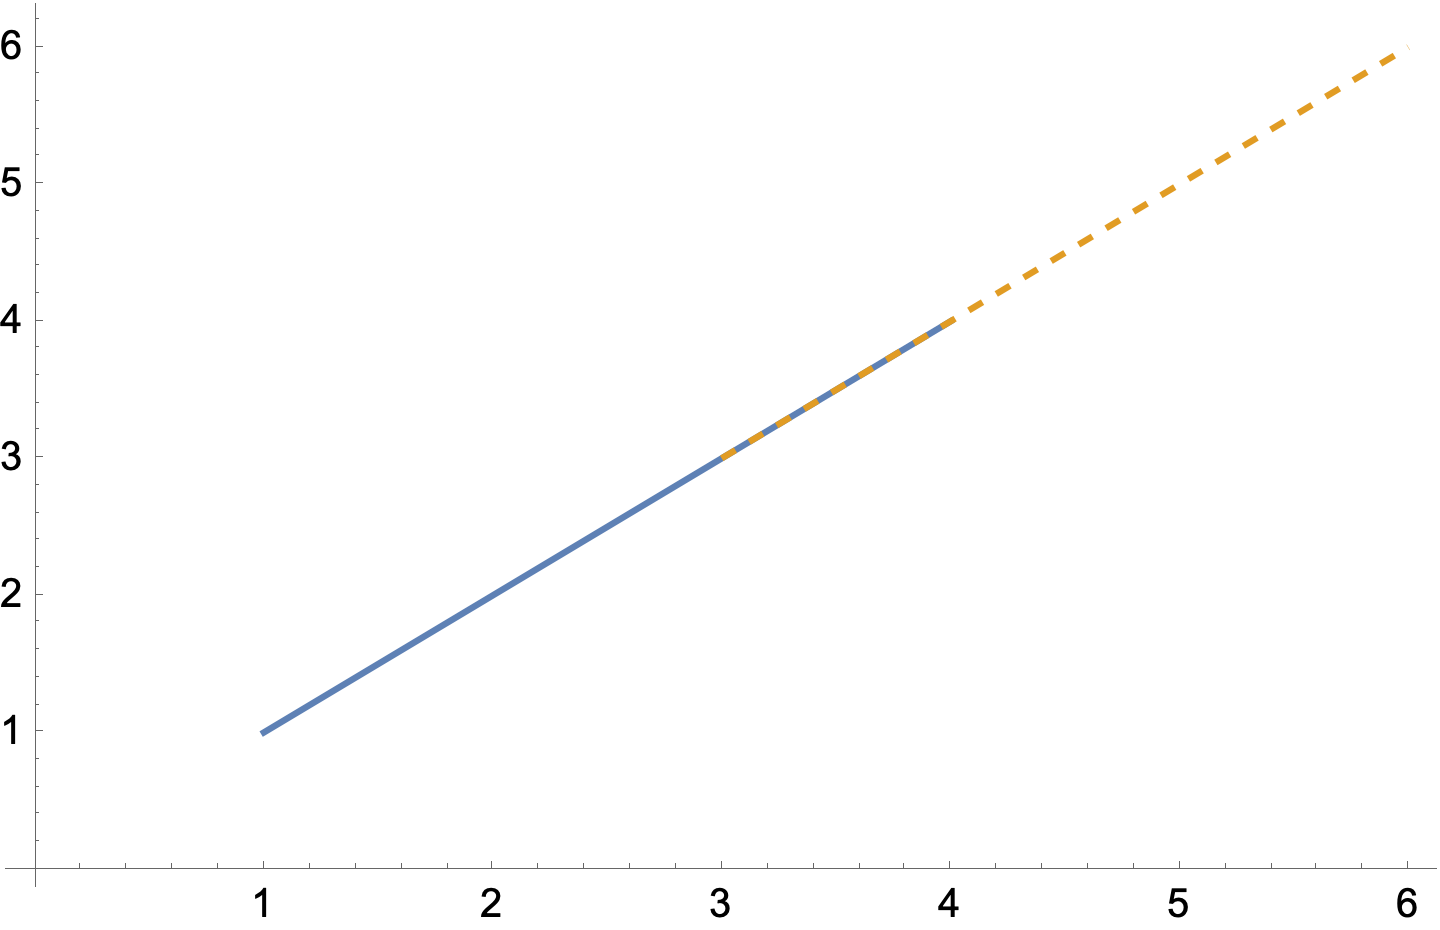
The data intervals overlap so that when each are Joined the second line is on top of the first and hides a portion of the first.

Using Dashed for the second line enables the first to show through.

ListPlot[data,
 PlotStyle -> {Automatic, Dashed},
 Joined -> True]

enter image description here

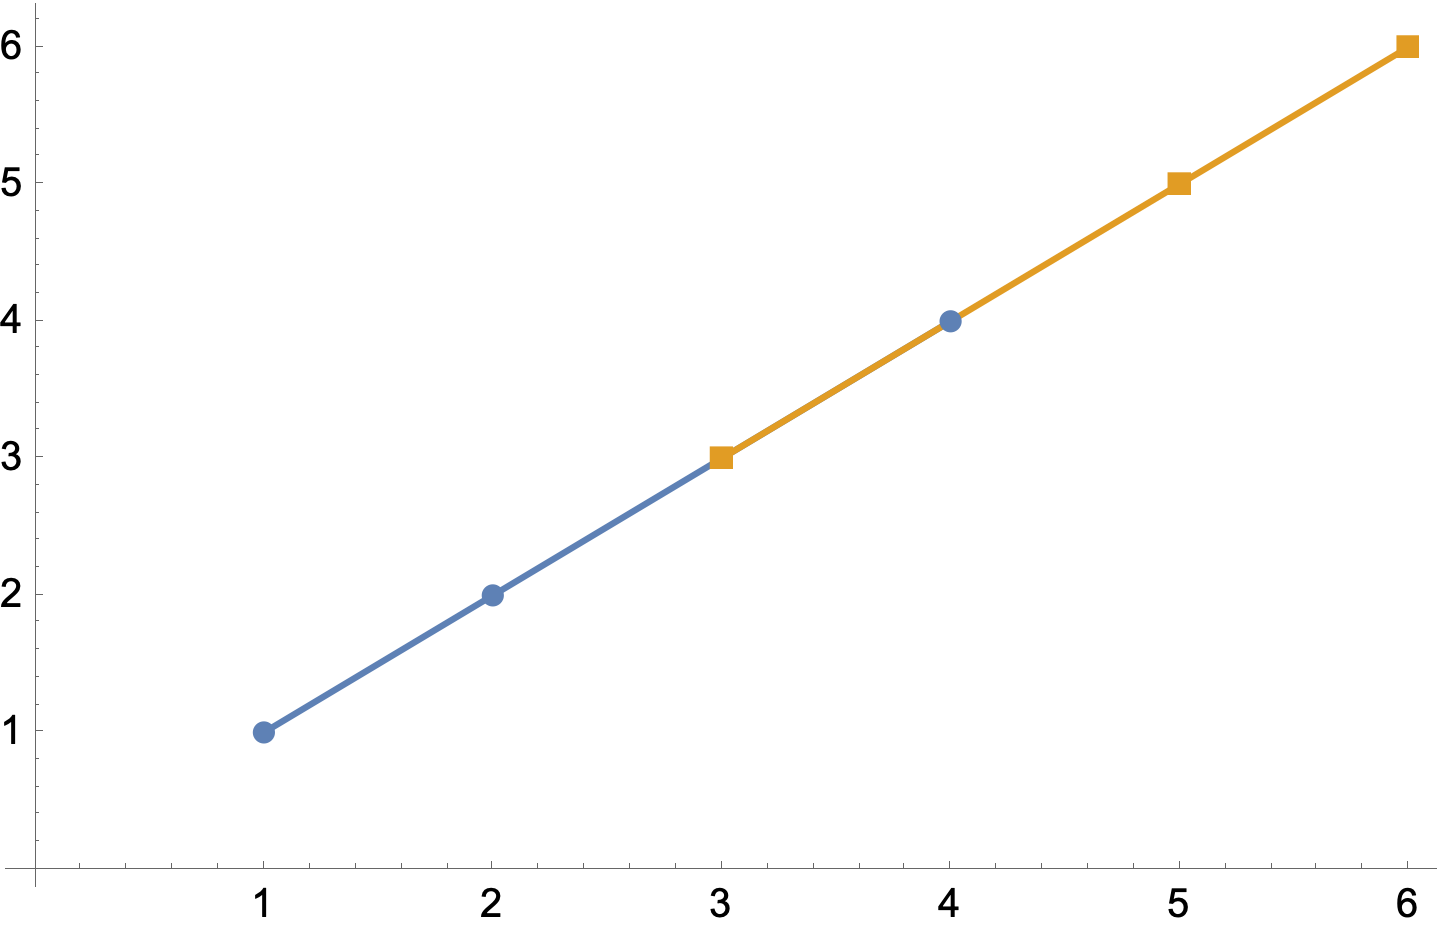
Alternatively, using PlotMarkers highlights the overlap.

ListPlot[data,
 PlotMarkers -> Automatic,
 Joined -> True]

enter image description here

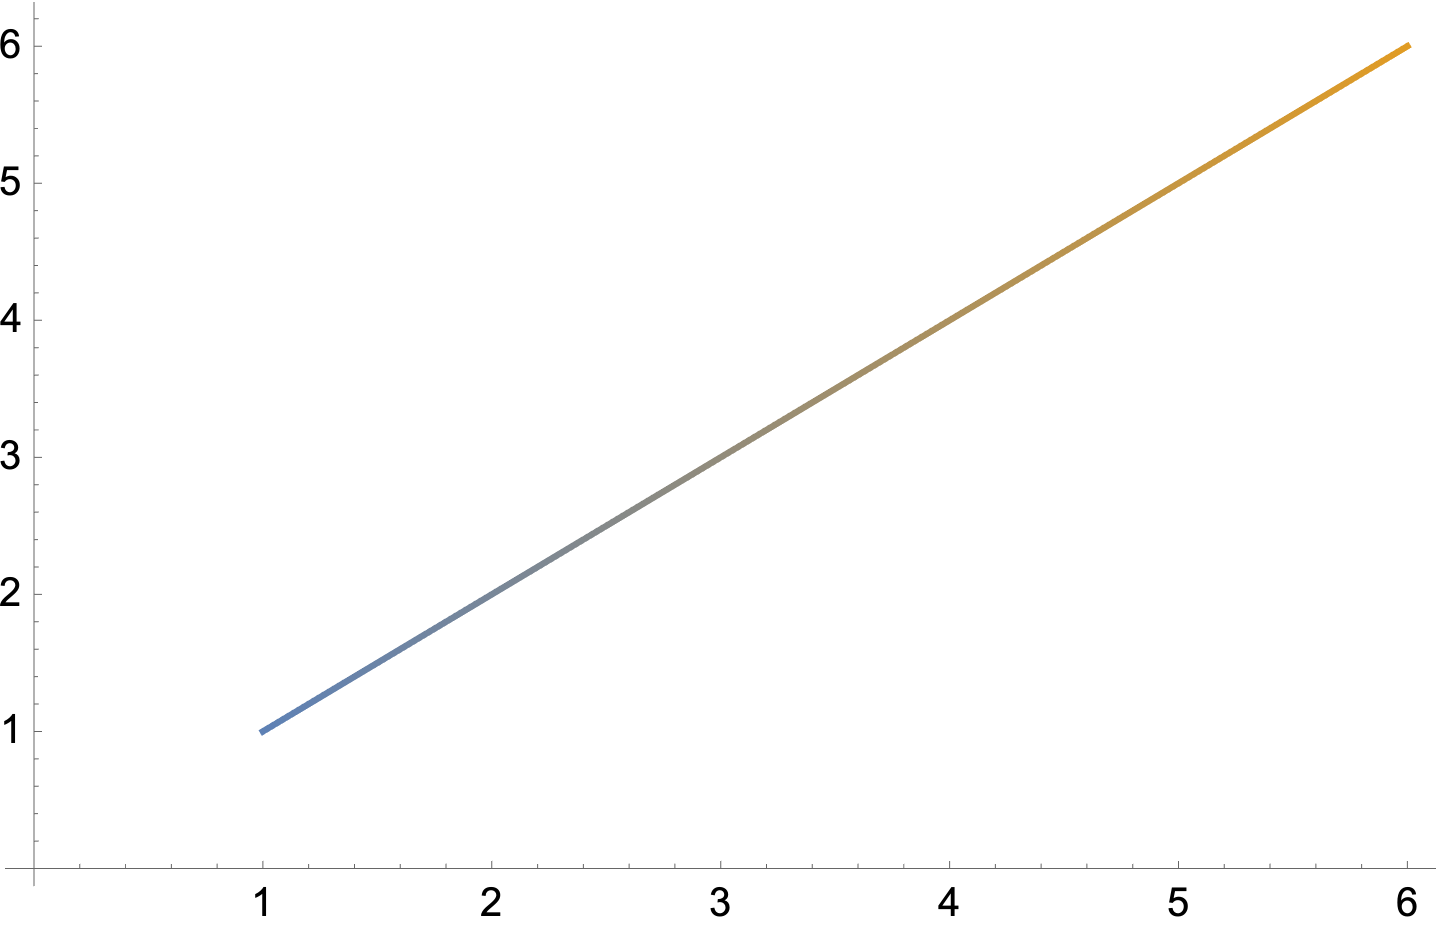
Or you can Blend the colors

ListPlot[Join @@ data,
 Joined -> True,
 ColorFunction -> (Blend[ColorData[97] /@ {1, 2}, #1] &)]

enter image description here

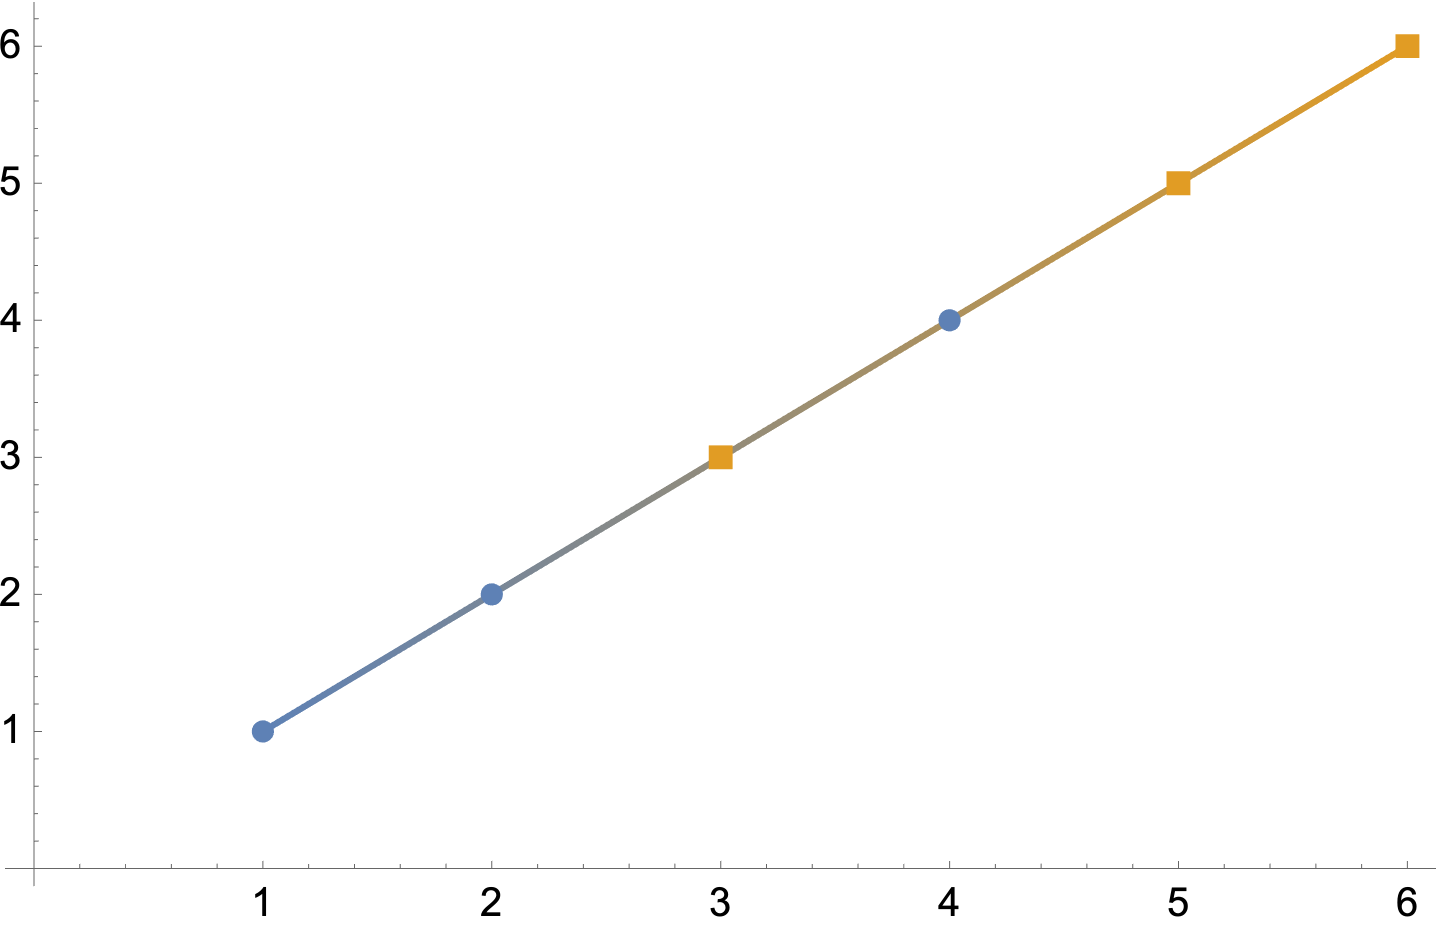
Blend colors with distinct PlotMarkers

Show[
 ListPlot[Join @@ data,
  Joined -> True,
  ColorFunction -> (Blend[ColorData[97] /@ {1, 2}, #1] &)],
 ListPlot[data,
  PlotMarkers -> Automatic]]

enter image description here

Or anything else you can think up.

$\endgroup$

Your Answer

By clicking “Post Your Answer”, you agree to our terms of service and acknowledge you have read our privacy policy.

Not the answer you're looking for? Browse other questions tagged or ask your own question.