0
$\begingroup$

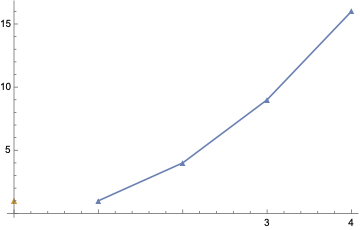
I'm trying to generate a joined plot which consists of a series of points from a table along with a single extra point added by hand. However, when taking the following approach, I end up with the table listplot and the single point plotted separately and unjoined. Any suggestions (MWE and plot below)?

ListPlot[{Table[{a, a^2}, {a, 1, 4}], {{0, 1}}}, {Joined -> True}, 
 PlotMarkers -> \[FilledUpTriangle]]

enter image description here

$\endgroup$

1 Answer 1

1
$\begingroup$

By having two sperate lists you are effectively creating two sperate plots so they are not connected and are different colors.
You can joint the new point to the original list in a few different ways:

ListPlot[Join[{{0, 1}}, Table[{a, a^2}, {a, 1, 4}]], {Joined -> True},
  PlotMarkers -> \[FilledUpTriangle]]
(Joins two 2-dimensional lists.)

or

ListPlot[
 Prepend[Table[{a, a^2}, {a, 1, 4}], {0, 1}], {Joined -> True}, 
 PlotMarkers -> \[FilledUpTriangle]]
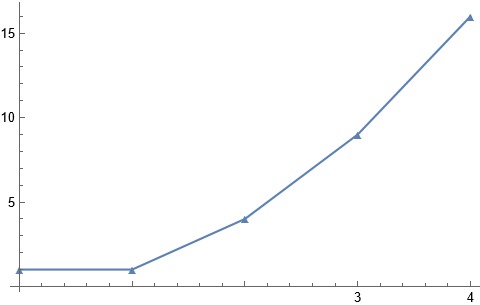
(Adds 1-dimensional element to the front of a 2-dimensional list)

enter image description here

$\endgroup$

Your Answer

By clicking “Post Your Answer”, you agree to our terms of service and acknowledge you have read our privacy policy.

Not the answer you're looking for? Browse other questions tagged or ask your own question.