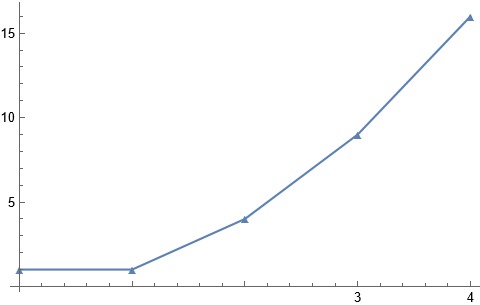
By having two sperate lists you are effectively creating two sperate plots so they are not connected and are different colors.
You can joint the new point to the original list in a few different ways:
ListPlot[Join[{{0, 1}}, Table[{a, a^2}, {a, 1, 4}]], {Joined -> True},
  PlotMarkers -> \[FilledUpTriangle]]
(Joins two 2-dimensional lists.)
or
ListPlot[
 Prepend[Table[{a, a^2}, {a, 1, 4}], {0, 1}], {Joined -> True},
 PlotMarkers -> \[FilledUpTriangle]]
(Adds 1-dimensional element to the front of a 2-dimensional list)

