12
$\begingroup$

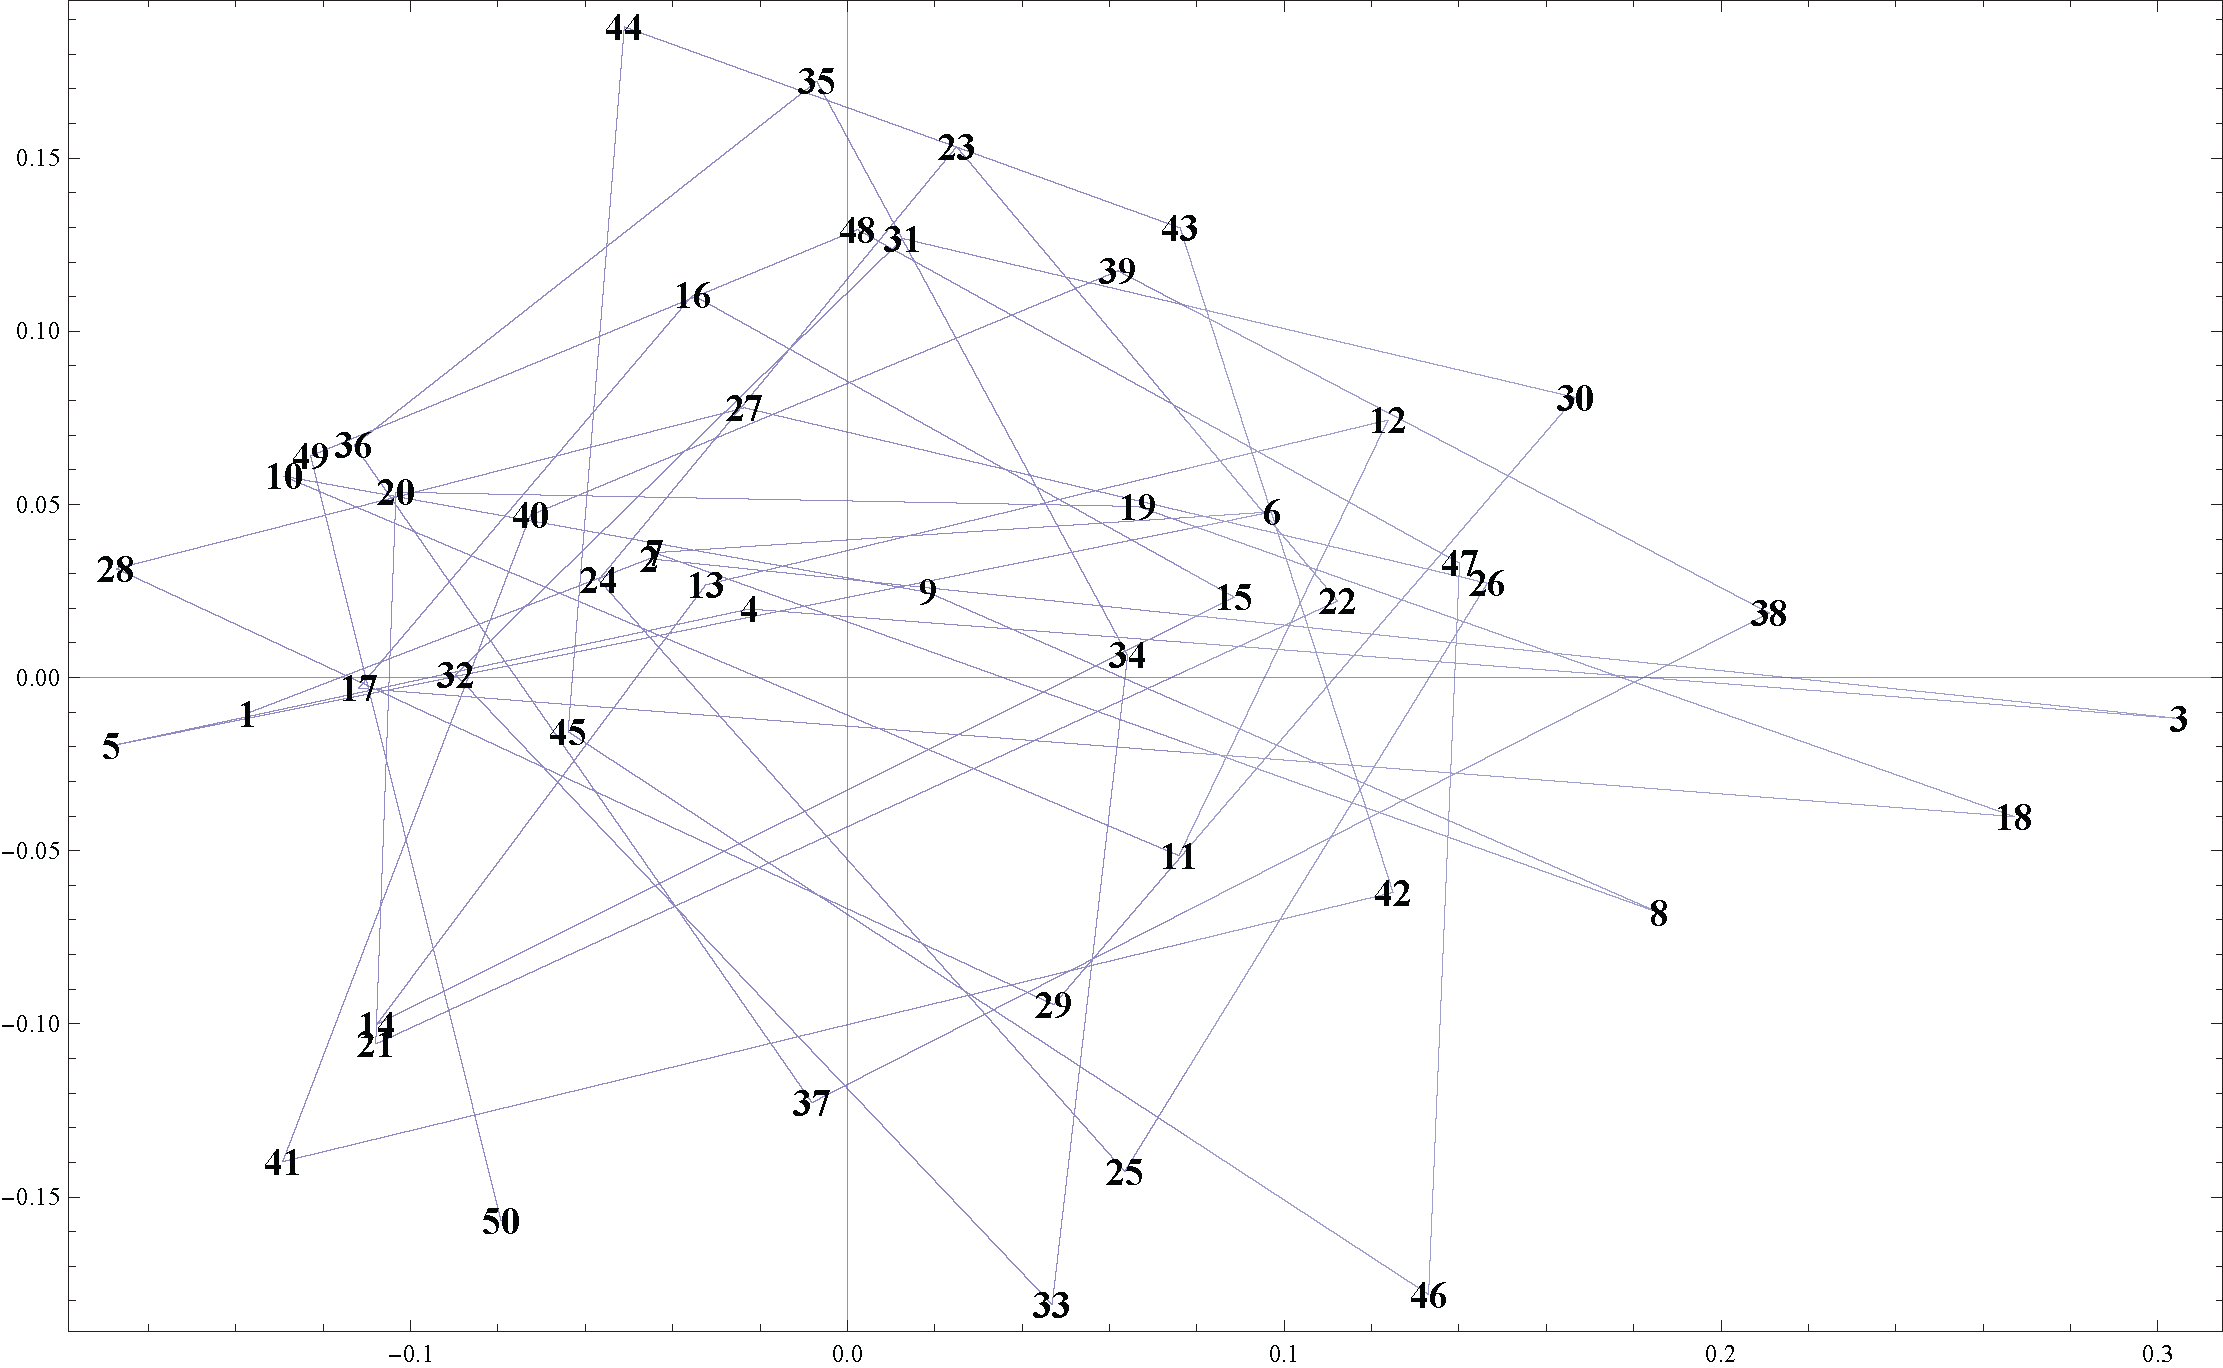
I have a collection of points

{{-0.137445, -0.0103507}, {-0.0452845, 0.0343154}, {0.30498, -0.0118266}, {-0.0224633, 0.0197979},
 {-0.168469, -0.0197066}, {0.0973217, 0.0478612}, {-0.0441388, 0.0360607}, {0.185982, -0.0679699},
 {0.0185057, 0.0245944}, {-0.129016, 0.0581276}, {0.0759223, -0.0514376}, {0.123763, 0.0743706}, 
 {-0.0324282, 0.0267871}, {-0.107764, -0.100215}, {0.0885256, 0.0232463}, {-0.0353817, 0.110461}, 
 {-0.111862, -0.00308756}, {0.267131, -0.0401582}, {0.0665588, 0.0494041}, {-0.103328, 0.0535261},
 {-0.107966, -0.105811}, {0.112237, 0.0221174}, {0.0250018, 0.153274}, {-0.0569079, 0.0282354}, 
 {0.0635016, -0.142617}, {0.146519, 0.027247}, {-0.0235671, 0.0778935}, {-0.167359, 0.0314445}, 
 {0.0472315, -0.0944644}, {0.166657, 0.0808811}, {0.0127167, 0.126777}, {-0.0896872, 0.00085879}, 
 {0.0468778, -0.181101}, {0.0641557, 0.00642259}, {-0.00698507, 0.172202}, {-0.112879, 0.0671148}, 
 {-0.00809596, -0.12273}, {0.211062, 0.0186191}, {0.0619741, 0.117436}, {-0.0725547, 0.0468807}, 
 {-0.129253, -0.139777}, {0.124918, -0.0620453}, {0.0761669, 0.129845}, {-0.0510648, 0.1879}, 
 {-0.063928, -0.0156006}, {0.133047, -0.178149}, {0.140128, 0.0330165}, {0.00229768, 0.129346}, 
 {-0.122887, 0.0639973}, {-0.079265, -0.156894}}

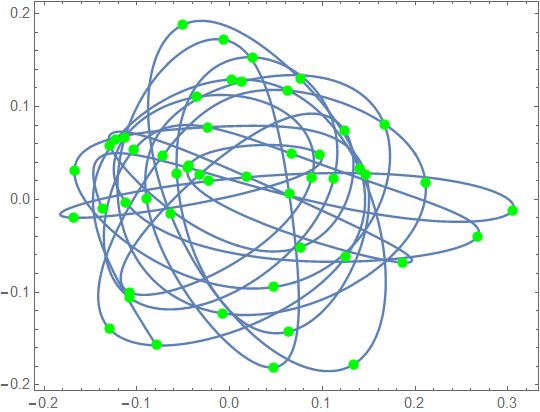
that look like this
enter image description here

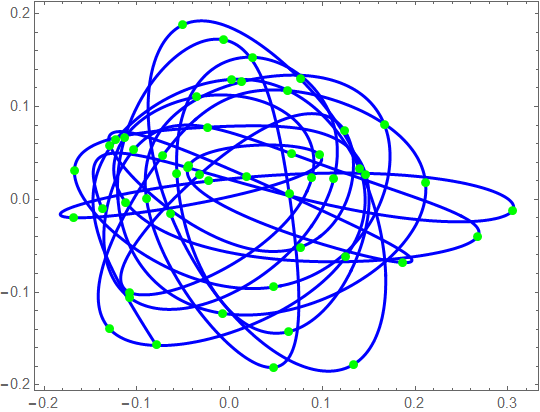
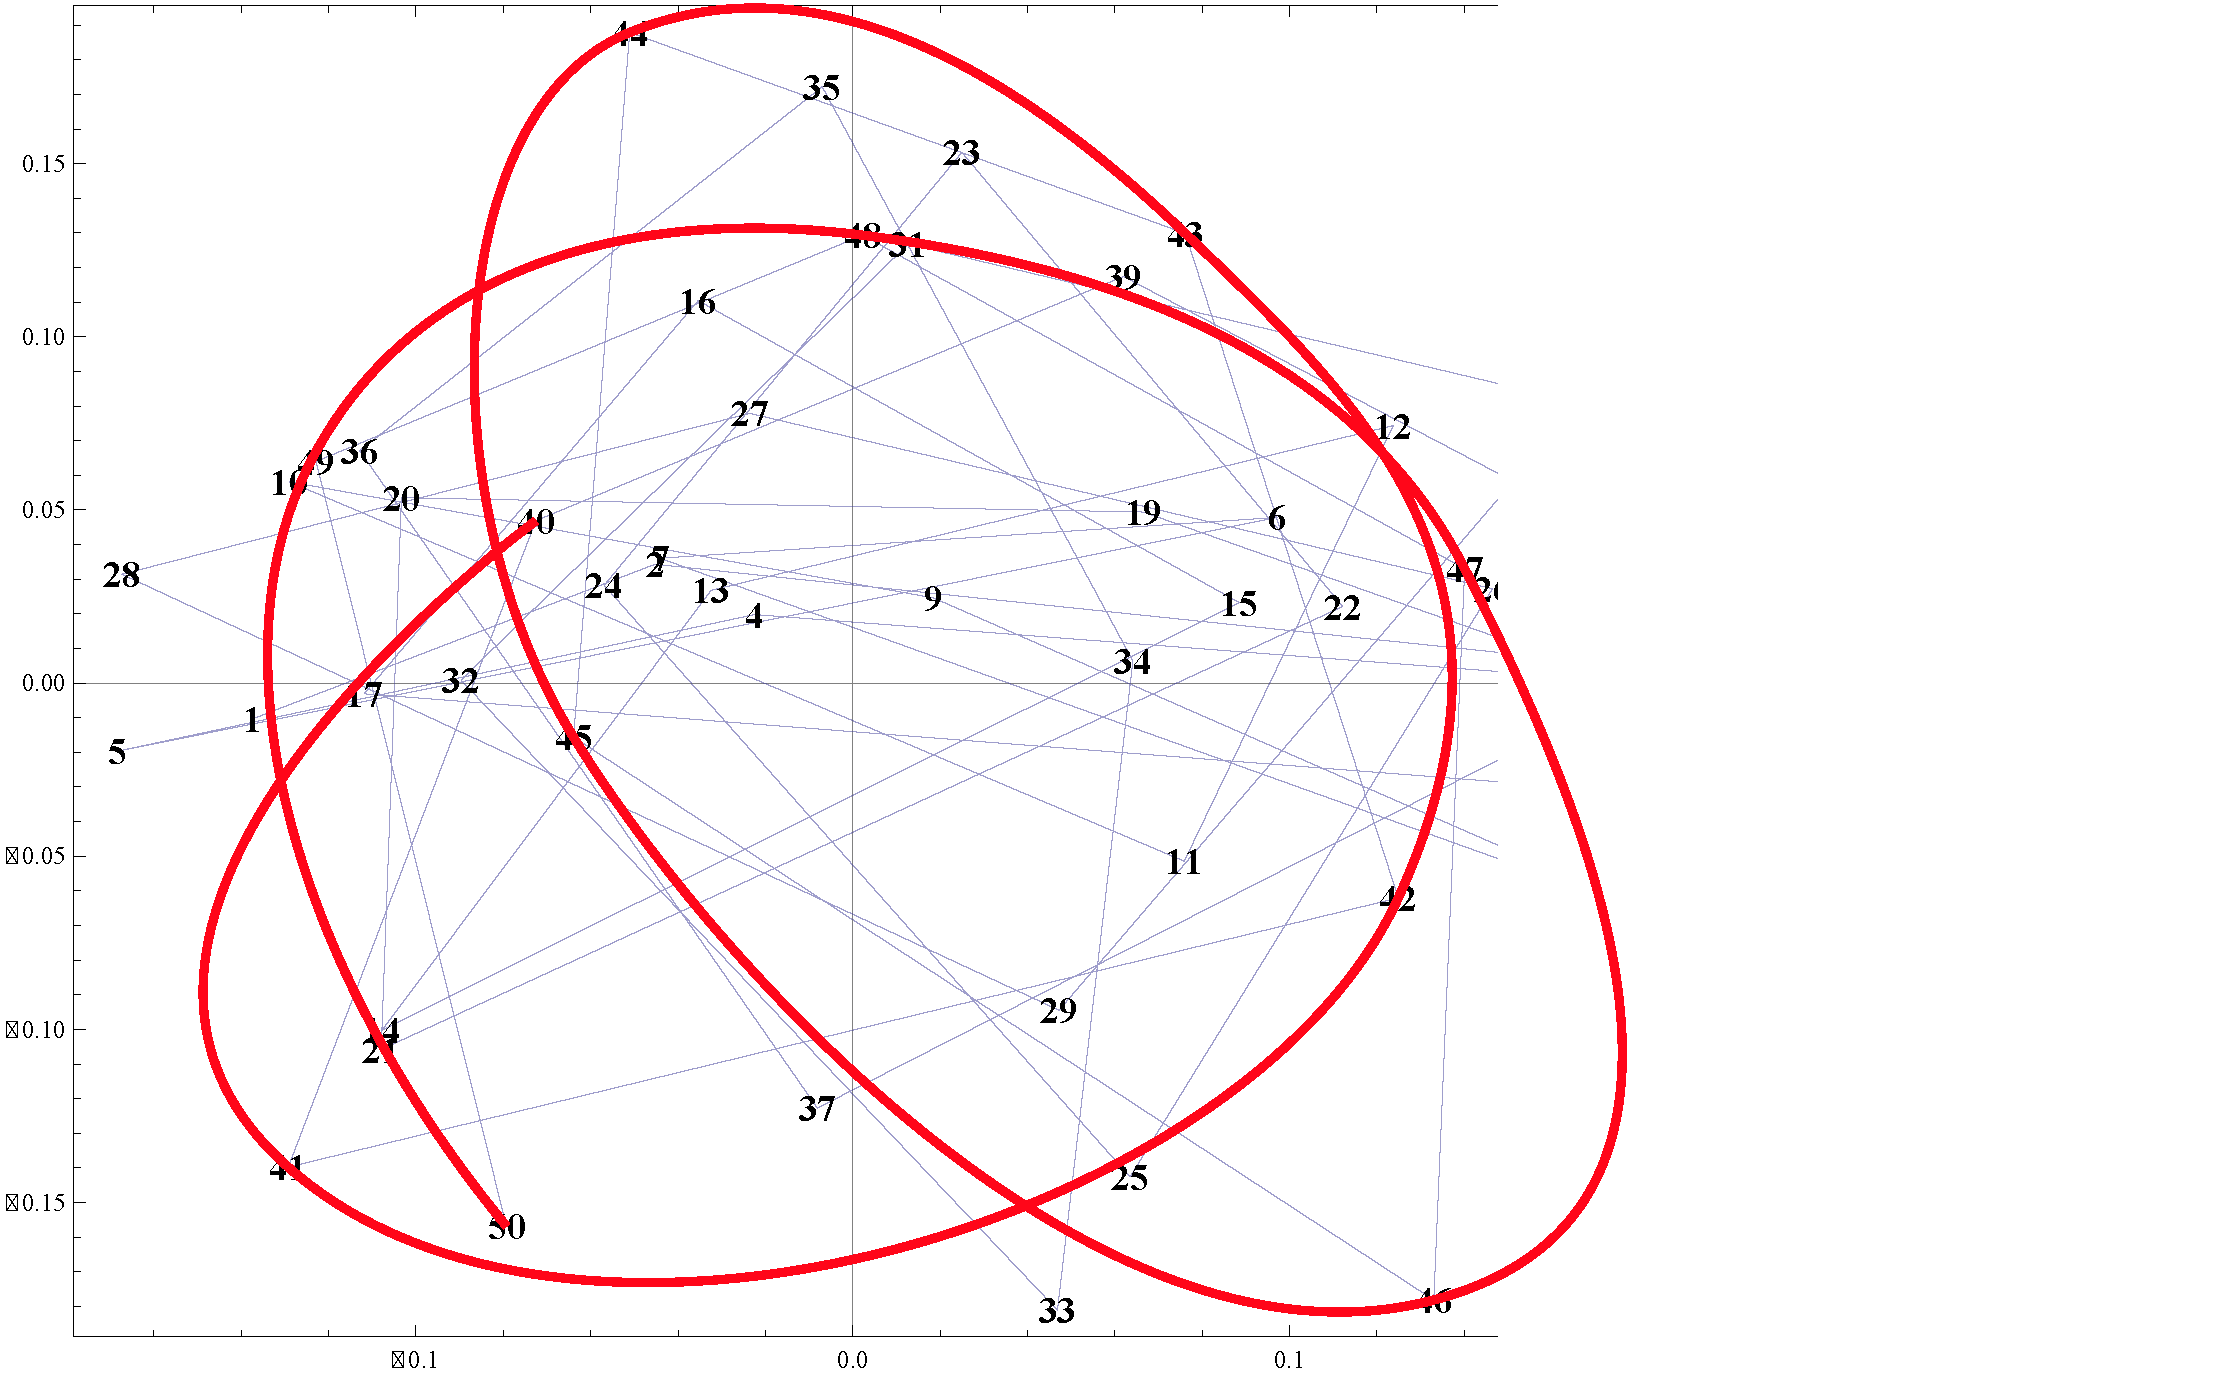
They are ordered in some sort of spiral, and I would like to join them with splines as shown below
enter image description here

The points are ordered clockwise (starting from 50 going backwards), and I would like the piecewise curves to be joined as smoothly as possible (doing another circuit if necessary before joining to the next point). How would I go about doing this?

Update

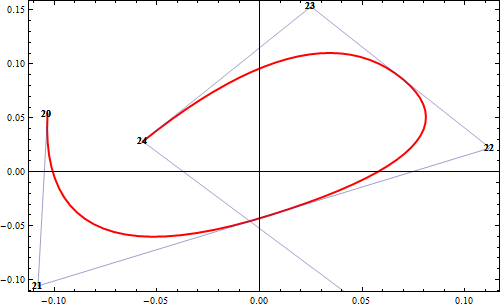
@kguler's answer is great, but doesn't join all of the points:
enter image description here

Is there a way to ensure the spline passes through each point?

$\endgroup$
1
  • $\begingroup$ [I would normally put this in a comment, but my reputation on this part of Stack is not high enough.] I assume you have tried using something like Fit[data,{1,x,x^2,x^3},x] for a cubic spline already? You could also find the convex hull for 4, 5, or 6 point sets inside your list and then model the fit to an ellipse. Then take the set of ellipses and smoothly interpolate them together. $\endgroup$ Commented Sep 25, 2014 at 13:58

5 Answers 5

13
$\begingroup$

The built-in functionality can do this directly:

{xs, ys} = Transpose[points];
xinterp = Interpolation[xs, Method -> "Spline"];
yinterp = Interpolation[ys, Method -> "Spline"];
ParametricPlot[{xinterp[t], yinterp[t]}, {t, 1, Length@points}, Epilog -> Point /@ points]

enter image description here

Without the "Spline" method, the interpolating functions are not always differentiable, which creates corners in the plot. The "Spline" method gives a differentiable function (actually twice-differentiable, since the default InterpolationOrder is 3). More information here: How does Interpolation really work?

$\endgroup$
8
  • $\begingroup$ I also tried this. With bigger InterpolationOrder it looks good enough :) $\endgroup$
    – ybeltukov
    Commented Sep 25, 2014 at 16:11
  • $\begingroup$ Ah, yes, but then it begins overshooting a lot. $\endgroup$
    – user484
    Commented Sep 25, 2014 at 20:10
  • $\begingroup$ It turns out that nondifferentiability is only a problem if you don't use the "Spline" method. I wonder why the documentation doesn't mention this. $\endgroup$
    – user484
    Commented Sep 26, 2014 at 0:41
  • $\begingroup$ Great! Indeed, there is the curves appear close, but the spline has a continuous derivative in docs (Method section for Interpolation). $\endgroup$
    – ybeltukov
    Commented Sep 26, 2014 at 11:51
  • 3
    $\begingroup$ It might be worth remarking that one can get a single interpolation of the curve with xyfn = Interpolation[MapIndexed[{#2, #1} &, points], Method -> "Spline"]. $\endgroup$
    – Michael E2
    Commented Sep 28, 2014 at 15:06
12
$\begingroup$

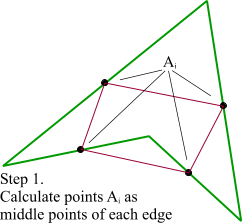
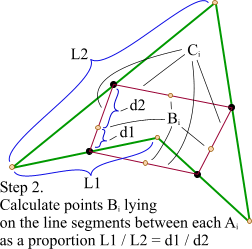
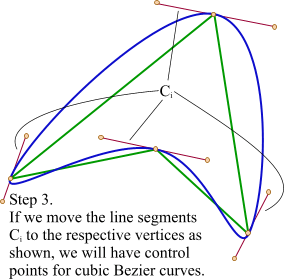
I appreciate kguler's elegant solution, but it doesn't join the points. To be more precise, it joins only every third point because Bezier line additionally takes 2 anchor points for each point. There are different methods to obtain these points. The simplest one is the following (pictures taken here)

enter image description here

enter image description here

enter image description here

In Mathematica it looks like the following code (for an open path)

pts = {{0, 0}, {1, 1}, {2, 0}, {5, 1}, {6, 0}, {7, 1}};

dist = Norm /@ Differences[pts];
k = 0.5;
coeff = Rest[dist]/(Most[dist] + Rest[dist]);
diff = Differences[pts, 1, 2];
a1 = pts - Join[{{0, 0}}, k (1 - coeff) diff, {{0, 0}}];
a2 = pts + Join[{{0, 0}}, k coeff diff , {{0, 0}}];
bezier = BezierCurve@Flatten[{a1, pts, a2}, {{2, 1}}][[2 ;; -2]];

Graphics[{Darker[Green], Line[pts], Red, Line@Transpose[{a1, a2}], 
  Black, PointSize[0.01], Point[pts], Red, Point@Join[a1, a2], Blue, 
  Thick, bezier}, ImageSize -> 700]

enter image description here

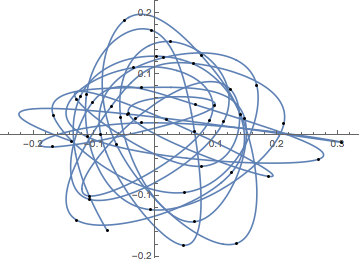
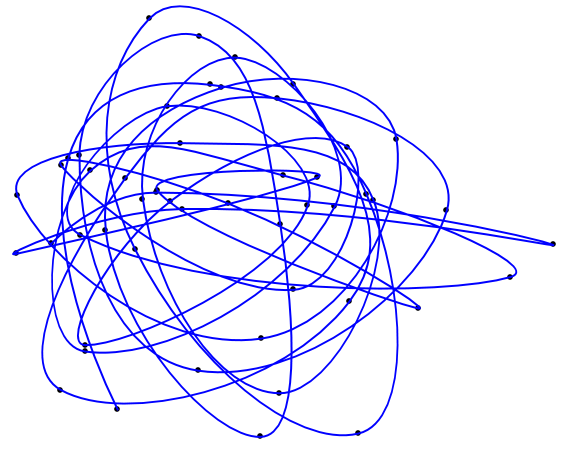
For OP's points:

Graphics[{PointSize[0.01], Point[pts], Blue, Thick, bezier}, ImageSize -> 700]

enter image description here

You can tune the coefficient k to change sharpness of corners.

$\endgroup$
4
  • $\begingroup$ Wonderful! Exactly what I was after - many thanks :) $\endgroup$
    – martin
    Commented Sep 25, 2014 at 15:11
  • $\begingroup$ How would I add anchor points / line segments to the first and last points of an open path? I have been trying for ages without much success! $\endgroup$
    – martin
    Commented Oct 2, 2014 at 10:46
  • 1
    $\begingroup$ @martin BezierCurve takes point1, right anchor for the point1, left anchor for the point2, point2, right anchor for the point2 and so on. $\endgroup$
    – ybeltukov
    Commented Oct 2, 2014 at 11:56
  • $\begingroup$ great - ok thanks $\endgroup$
    – martin
    Commented Oct 2, 2014 at 12:17
7
$\begingroup$

As an alternative, one can use J.M.'s nice implementation of a spline with centripetal parametrization which gives (IMO) a "natural" and undisturbed curve.

belisarius has packed J.M.'s code into a function in this answer (which would be much more suitable here than in that thread because despite large number of upvotes it does not answer the original question).

I have shortened and redesigned belisarius's code:

ClearAll[toSplineData];
toSplineData[data_, order_, prec_] /; MatrixQ[data, NumericQ] := 
 Module[{tvals, bas, ctrlpts, knots, l = Length[data]}, 
  tvals = FoldList[Plus, 0, Normalize[(Norm /@ Differences[data])^(1/2), Total]];
  (*knots for interpolating B-spline*)
  knots = Join[ConstantArray[0, order + 1], 
               MovingAverage[ArrayPad[tvals, -1], order], 
               ConstantArray[1, order + 1]];
  (*basis function matrix*)
  bas = Table[BSplineBasis[{order, knots}, j - 1, N[tvals[[i]], prec]], {i, l}, {j, l}];
  ctrlpts = LinearSolve[bas, data];
  {ctrlpts, order, knots}]

Now the function toSplineData can be used in the following ways:

{ctrlpts, m, knots} = toSplineData[points, 5, MachinePrecision];

plot = ParametricPlot[
  BSplineFunction[ctrlpts, SplineDegree -> m, SplineKnots -> knots][t] // Evaluate, {t, 0, 1}, 
  Axes -> None, Frame -> True, ImageSize -> Medium,
  Epilog -> {Directive[Green, AbsolutePointSize[6]], Point[points]}]

plot

Graphics[{{Blue, Thick, 
           BSplineCurve[ctrlpts, SplineDegree -> m, SplineKnots -> knots]}}, Options@plot]

plot2

Please note that this function does not have all the flexibility of J.M.'s original code.

$\endgroup$
1
  • $\begingroup$ Very nice! Looking forward to testing :) $\endgroup$
    – martin
    Commented Sep 28, 2014 at 11:23
6
$\begingroup$
llp = ListLinePlot[points, ImageSize -> 500];
llp2 = llp /. Line[x___] :> BSplineCurve[x, SplineDegree -> 2];
Row[{llp, llp2}]

enter image description here

where

points = {{-0.137445, -0.0103507}, {-0.0452845,  0.0343154}, {0.30498, -0.0118266}, 
          {-0.0224633, 0.0197979}, {-0.168469, -0.0197066}, {0.0973217, 0.0478612}, 
          {-0.0441388, 0.0360607}, {0.185982, -0.0679699}, {0.0185057,  0.0245944}, 
          {-0.129016,  0.0581276}, {0.0759223, -0.0514376}, {0.123763,  0.0743706},
          {-0.0324282, 0.0267871}, {-0.107764, -0.100215}, {0.0885256,  0.0232463},
          {-0.0353817, 0.110461}, {-0.111862, -0.00308756}, {0.267131, -0.0401582},
          {0.0665588, 0.0494041}, {-0.103328,  0.0535261}, {-0.107966, -0.105811}, 
          {0.112237,  0.0221174}, {0.0250018, 0.153274}, {-0.0569079,  0.0282354}, 
          {0.0635016, -0.142617}, {0.146519,  0.027247}, {-0.0235671, 0.0778935}, 
          {-0.167359,  0.0314445}, {0.0472315, -0.0944644}, {0.166657, 0.0808811}, 
          {0.0127167, 0.126777}, {-0.0896872,  0.00085879}, {0.0468778, -0.181101},
          {0.0641557, 0.00642259}, {-0.00698507, 0.172202}, {-0.112879, 0.0671148},
          {-0.00809596, -0.12273}, {0.211062, 0.0186191}, {0.0619741, 0.117436}, 
          {-0.0725547,  0.0468807}, {-0.129253, -0.139777}, {0.124918, -0.0620453},
          {0.0761669, 0.129845}, {-0.0510648, 0.1879}, {-0.063928, -0.0156006}, 
          {0.133047, -0.178149}, {0.140128, 0.0330165}, {0.00229768, 0.129346}, 
          {-0.122887, 0.0639973}, {-0.079265, -0.156894}};
$\endgroup$
7
  • $\begingroup$ great! thank you! $\endgroup$
    – martin
    Commented Sep 25, 2014 at 14:14
  • $\begingroup$ @martin, my pleasure.. $\endgroup$
    – kglr
    Commented Sep 25, 2014 at 14:18
  • $\begingroup$ I have noticed on some points the spline changes direction - is it possible to specify that the points are always joined by anticlockwise curve, for example? (Even if another circuit has to be made?) $\endgroup$
    – martin
    Commented Sep 25, 2014 at 14:18
  • $\begingroup$ ... It does seem to avoid this behaviour if I drop points 1-10 though $\endgroup$
    – martin
    Commented Sep 25, 2014 at 14:22
  • 1
    $\begingroup$ @martin, there a quite a few possibilities to play with the option settings (SplineDegree, SplineKnots, SplineWeights). Not sure what the right option settings would like to get something close to the second picture in your post. $\endgroup$
    – kglr
    Commented Sep 25, 2014 at 14:32
5
$\begingroup$

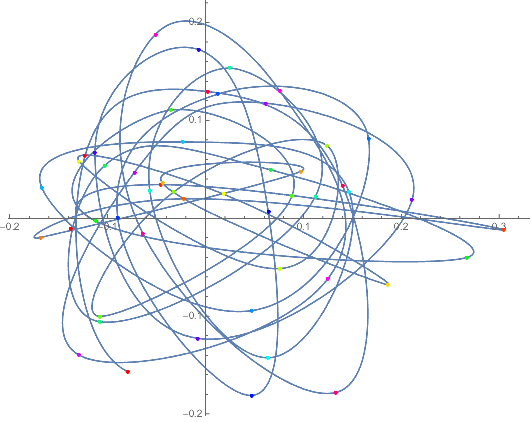
An alternative way to force Interpolation to construct a differentiable interpolation is to specify derivatives at the interior points. To get a good curvature, I used 70% of the vector (difference) between the points adjacent to a given point.

xyfn = Interpolation @ Thread @
    {List /@ Range @ Length @ points,
     points,
     Join[{Automatic}, 0.7 Differences[points, 1, 2], {Automatic}]};

ParametricPlot[xyfn[t], {t, 1, Length @ points}, 
 Epilog -> {PointSize[Medium], 
   Point[points, VertexColors -> Hue /@ Rescale @ Range @ Length @ points]}]

Mathematica graphics

$\endgroup$
1
  • $\begingroup$ great! Lots to experiment with now! $\endgroup$
    – martin
    Commented Sep 28, 2014 at 16:20

Your Answer

By clicking “Post Your Answer”, you agree to our terms of service and acknowledge you have read our privacy policy.

Not the answer you're looking for? Browse other questions tagged or ask your own question.