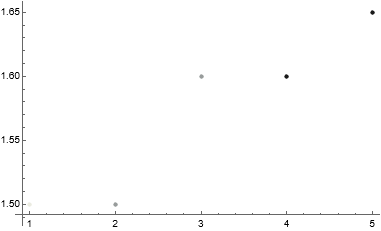
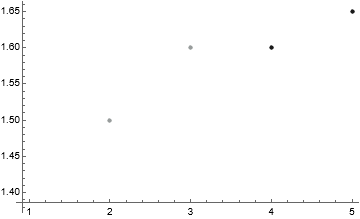
I would like to plot data so that the first column is in the x axis, the second column is in the y axis and the third column is the input for a custom ColorFunction. The ColorFunction is simple: white if the third column is 0 and increasingly darker shades of gray as values in the third column increase.
Part of my problem is that the data I am working with is not symmetric so I am having problems calling it.
Here is a MWE
list = {{{1, 1.5, 10}}, {{2, 1.5, 11}, {2, 1.4, 0}}, {{3, 1.5, 0}, {3,
     1.4, 0}, {3, 1.6, 11}}, {{4, 1.5, 0}, {4, 1.4, 0}, {4, 1.6,
    13}, {4, 1.55, 0}}, {{5, 1.5, 0}, {5, 1.4, 0}, {5, 1.6, 0}, {5,
    1.55, 0}, {5, 1.65, 13}}}

ListPlot[Flatten[list, 1][[All, {1, 2}]],
 ColorFunction ->
  If[Flatten[list, 1][[All, {3}]] > 0, ColorData["GrayTones"],
   White], ColorFunctionScaling -> False]
I'm sure this will be quite simple for someone on here. Any suggestions are much appreciated


