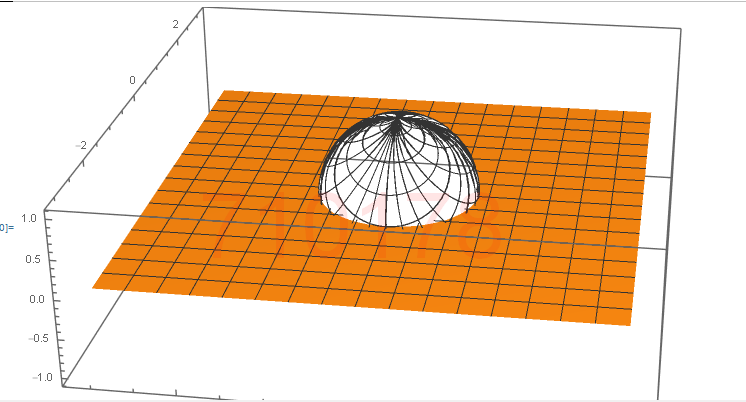
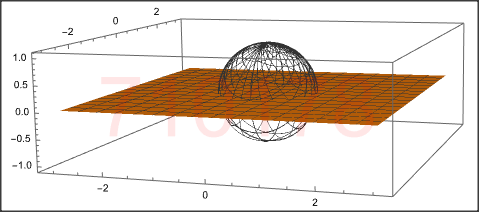
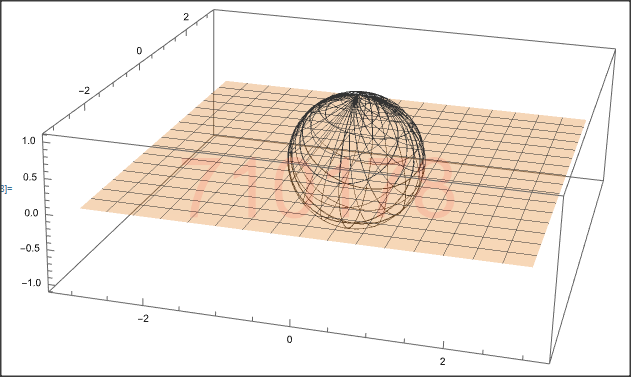
This is the code I used Edit: This is the full code to create this image
R[r_, s_] := {r, s, 0};
S[r_, s_] := {2 r/(r^2 + s^2 + 1), 2 s/(r^2 + s^2 + 1), (r^2 + s^2 - 1)/(r^2 + s^2 + 1)};
f[t_] = Tan[(Pi/2) * t];


Show[ParametricPlot3D[R[r, s], {r, -3, 3}, {s, -3, 3}, ImageSize -> 600,
  Epilog -> Inset[Style[" 710178 ", FontSize -> 84, Red, Opacity[0.1]]]],
 ParametricPlot3D[S[f[r], f[s]], {r, -3, 3}, {s, -3, 3},PlotStyle -> Transparent]]
The reason I'm trying to make it transparent is because I have to plot curves on the sphere and currently when I do plot, I can't see the curves.


R,S, andfare missing. $\endgroup$Show[ParametricPlot3D[R[r, s], {r, -3, 3}, {s, -3, 3}, ImageSize -> 600, PlotStyle -> Opacity[0.2], Epilog -> Inset[Style[" 710178 ", FontSize -> 84, Red, Opacity[0.1]]]], ParametricPlot3D[S[f[r], f[s]], {r, -3, 3}, {s, -3, 3}, PlotStyle -> Opacity[0.1]]]$\endgroup$PlotStyle-> Directive[Orange, Opacity[0.1]], but that didn't do anything $\endgroup$PlotStyle -> FaceForm[]gives what you need. $\endgroup$