0
$\begingroup$

I want to write axises in scientific digits, without changing the original data format.

plotdata ={{1000, Around[0.0005333333333333334, 0.0004509249752822894]}, {2000,Around[0.0024333333333333334`,0.0005131601439446884]}, {5000, Around[0.006033333333333332, 0.0017616280348965077`]}, {7500, Around[0.01, 0.002]}};
tickFunc = Charting`ScaledTicks[{Identity, Identity}, TicksLength -> {.03, .01}][##] &;
ListPlot[plotdata, FrameLabel -> {mass, length},Frame -> True, FrameTicks -> {{tickFunc, None}, {tickFunc, None}}, PlotStyle ->Thickness[0.005], PlotMarkers -> {Automatic, 8}, Frame -> {{True, None}, {True, None}}, ImageSize -> 500, LabelStyle ->Directive[Black, FontFamily -> "Helvetica"], BaseStyle -> {FontSize -> 16}]

(I used the tickFunc according to the following page.) Increasing the length of frame ticks )

What I want to do is to make the x axis 2.000, 4.000,...10^3 and y axis to 2.50, 5.00, ... ^10-3.
I don't want to make the original data, but I want to change only the number of axis when displaying. Since I have many data, with different order, I don't want to settle each axis number by hand.

If anyone knows how to do this, please help me.

$\endgroup$

1 Answer 1

1
$\begingroup$

Since I have many data, with different order

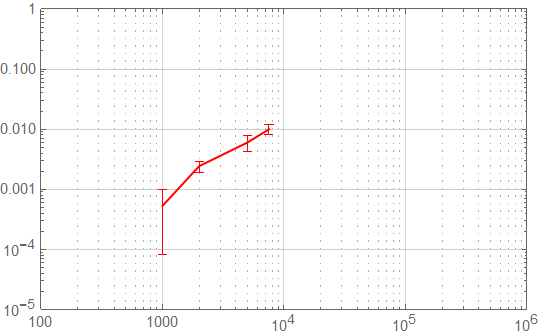
I think you should consider using a ListLogLogPlot or ListLogLinearPlot. With little manipulation you can turn on/off the gridlines in my solution that you don't need since you seem more focused on having tick marks.

Similar topic has been discussed previously I must admit that I am struggling with the FrameTick labels.

Would some other contributor(s) please help me print the superscript 10^i correctly on the x-axis and y-axis.

ListLogLogPlot[plotdata,
 GridLines -> {
   Flatten[
    Table[{i 10^j, 
      If[i == 1, {GrayLevel[0.6], Thin}, {Dotted, 
        GrayLevel[0.2]}]}, {j, 2, 6, 1}, {i, 9}], 1],
   {10^-5, 10^-4, 10^-3, 10^-2, 10^-1, 10^-0}
   },
 PlotStyle -> Red,
 PlotRange -> {{100, 10^6}, {10^-5, 10^0}},
 Frame -> True,
 FrameTicks ->
  {
   Table[{N@Log10[10^i], Style[Superscript[10, i]]}, {i, 2, 6}],
   None,
   Table[{N@Log10[10^-i], Style[Superscript[10, -i]]}, {i, 5, 0, -1}], 
   None
   },
 Joined -> True]

enter image description here

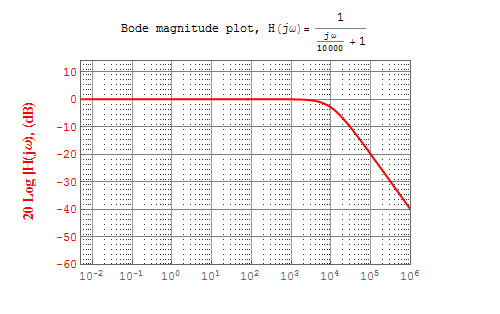
I learned to plot the log GridLines from a post by Sjored DeVries from a decade ago so can't really remember what the title of the post was [Apologies]. M7 had just been released. Back then I fiddled with a Bode Plot (LogLinearPlot) in M7 that came out just fine.

enter image description here

$\endgroup$

Your Answer

By clicking “Post Your Answer”, you agree to our terms of service and acknowledge you have read our privacy policy.

Not the answer you're looking for? Browse other questions tagged or ask your own question.