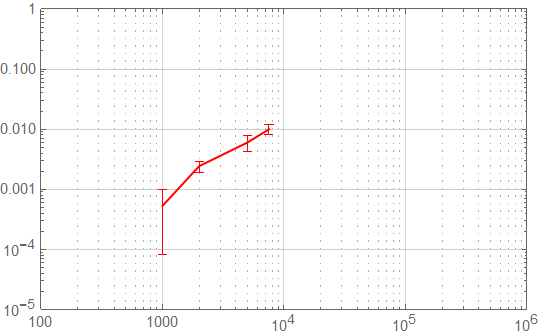
I want to write axises in scientific digits, without changing the original data format.
plotdata ={{1000, Around[0.0005333333333333334, 0.0004509249752822894]}, {2000,Around[0.0024333333333333334`,0.0005131601439446884]}, {5000, Around[0.006033333333333332, 0.0017616280348965077`]}, {7500, Around[0.01, 0.002]}};
tickFunc = Charting`ScaledTicks[{Identity, Identity}, TicksLength -> {.03, .01}][##] &;
ListPlot[plotdata, FrameLabel -> {mass, length},Frame -> True, FrameTicks -> {{tickFunc, None}, {tickFunc, None}}, PlotStyle ->Thickness[0.005], PlotMarkers -> {Automatic, 8}, Frame -> {{True, None}, {True, None}}, ImageSize -> 500, LabelStyle ->Directive[Black, FontFamily -> "Helvetica"], BaseStyle -> {FontSize -> 16}]
(I used the tickFunc according to the following page.) Increasing the length of frame ticks )
What I want to do is to make the x axis 2.000, 4.000,...10^3 and y axis to 2.50, 5.00, ... ^10-3.
I don't want to make the original data, but I want to change only the number of axis when displaying. Since I have many data, with different order, I don't want to settle each axis number by hand.
If anyone knows how to do this, please help me.


