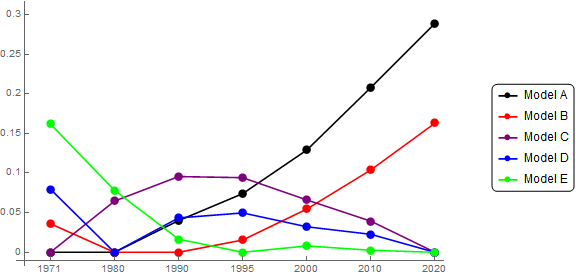
Here's mine:
plot = Show[
  ListPlot[{{0, 0}, {5, 0}, {10, 0.0400}, {15, 0.0740}, {20,
     0.129}, {25, 0.208}, {30, 0.289}}, InterpolationOrder -> None,
   Mesh -> Full, MeshStyle -> {Directive[PointSize[.02], Black]},
   Joined -> True, PlotStyle -> Black],
  ListPlot[{{0, 0.0361}, {5, 0}, {10, 0}, {15, 0.0155}, {20,
     0.0545}, {25, 0.104}, {30, 0.163}}, InterpolationOrder -> None,
   Mesh -> Full, MeshStyle -> {Directive[PointSize[.02], Red]},
   Joined -> True, PlotStyle -> Red]
  , ListPlot[{{0, 0}, {5, 0.0646}, {10, 0.0956}, {15, 0.0942}, {20,
     0.0661}, {25, 0.0393}, {30, 0}}, InterpolationOrder -> None,
   Mesh -> Full, MeshStyle -> {Directive[PointSize[.02], Purple]},
   Joined -> True, PlotStyle -> Purple]
  , ListPlot[{{0, 0.0797}, {5, 0}, {10, 0.0434}, {15, 0.0497}, {20,
     0.0322}, {25, 0.0227}, {30, 0}}, InterpolationOrder -> None,
   Mesh -> Full
   , MeshStyle -> {Directive[PointSize[.02], Blue]}, Joined -> True,
   PlotStyle -> Blue]
  , ListPlot[{{0, 0.162}, {5, 0.0783}, {10, 0.0166}, {15, 0}, {20,
     0.00804}, {25, 0.00256}, {30, 0}}, InterpolationOrder -> None,
   Mesh -> Full, MeshStyle -> {Directive[PointSize[.02], Green]},
   Joined -> True, PlotStyle -> Green]
  , Frame -> False,
  Ticks -> {{{0, "1971"}, {5, "1980"}, {10, "1990"}, {15,
      "1995"}, {20, "2000"}, {25, "2010"}, {30, "2020"}}, {0.05,
     0.10, 0.15, 0.20, 0.25, 0.30}}, PlotRange -> {{0, 30}, {0, .3}},
  PlotLegends ->
   Placed[LineLegend[{"Model A", "Model B", "Model C", "Model D",
      "Model E"}, LegendFunction -> "Frame",
     LegendMarkers -> True], {5, 0.25}]
  ]
Two problems are: First, my Ticks label is missing (only on $x=0$) tried to rescale as suggested on tick-label-is-missing but didn't work. Second, i was fail to make a legend. The legend should have a frame and each legend has a mark i.e. a circle mark just like each of the graph.
Hope you can help me. Thanks!

